An official website of the United States government
Here's how you know
Official websites use .gov
A
.gov website belongs to an official
government organization in the United States.
Secure .gov websites use HTTPS
A lock (
) or https:// means you've safely
connected to the .gov website. Share sensitive
information only on official, secure websites.
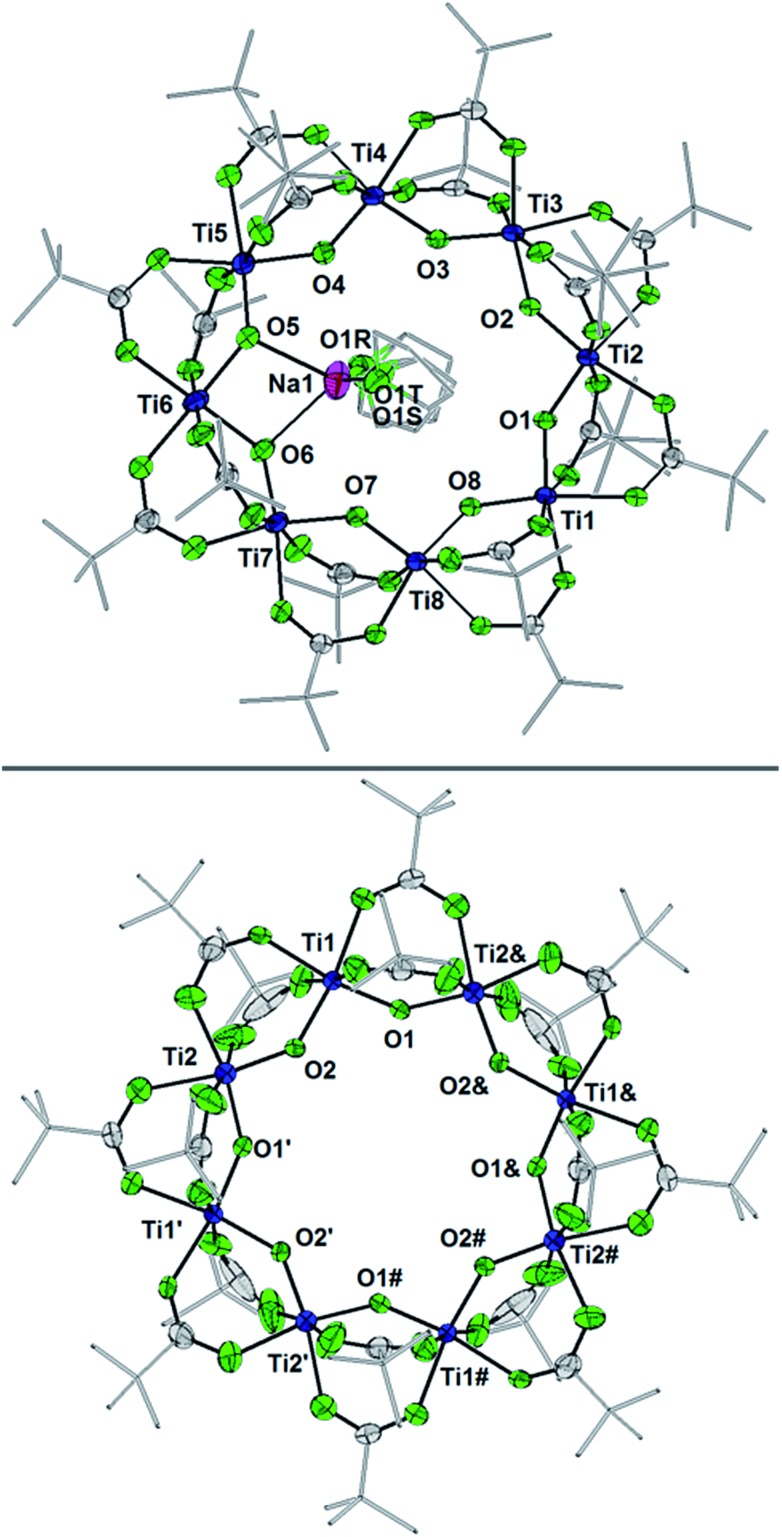
 . For clarity, H-atoms are omitted and tBu groups are shown as sticks. There are two THF ligands to Na+ that are disordered, as shown (S: 24.5%, R: 75.5%); see the ESI.
 : Ti1–O2 1.8445(1), Ti1–O1 1.7990(1), Ti2–O1′ 1.8514(1), Ti2–O2 1.7666(1).