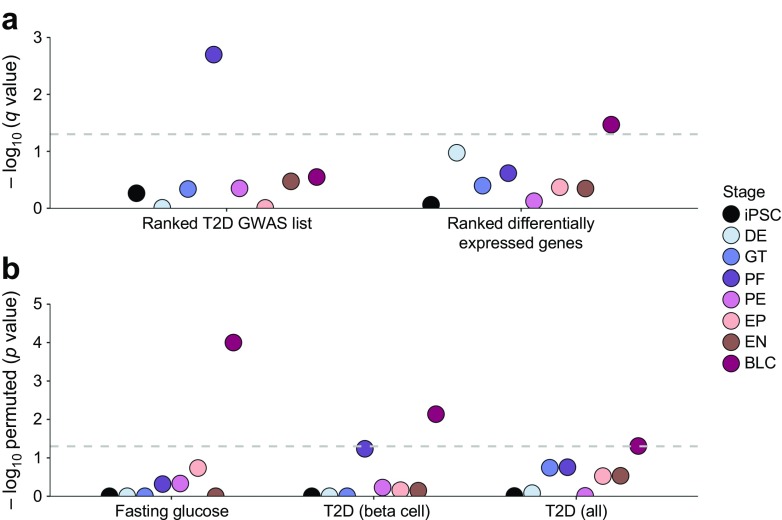
Fig. 2.
Both developing and mature islet-like cells are enriched for genes within type 2 diabetes-associated loci. (a) Results from the GSEA. SNPs from the type 2 diabetes GWAS meta-analysis from DIAGRAM (96 loci) [24] were mapped to genes, and type 2 diabetes association scores were calculated for each gene using MAGENTA. Two complementary analyses were performed: enrichment of all genes ordered by their MAGENTA scores in sets of differentially expressed genes for each stage (Ranked T2D GWAS list), and enrichment of differentially expressed genes per stage (ordered by q value) in significant (p < 0.05 by MAGENTA) gene scores (ranked differentially expressed genes). The y-axis represents the results of the GSEA in FDR-adjusted p values (q values, −log10). The horizontal grey dashed line marks the 5% significance threshold. (b) Results for the hypergeometric enrichment analysis. Enrichment was tested for all differentially expressed genes per stage in the 96 type 2 diabetes credible intervals [T2D (all)] from DIAGRAM [24] and the 16 fasting glucose credible intervals (Fasting glucose) from ENGAGE [25] (ESM Table 10), and for all differentially expressed genes in only physiological type 2 diabetes loci [T2D (beta cell)] (ESM Table 11). We consider beta cell function loci as 15 loci influencing hyperglycaemia, beta cell function and insulin processing [26, 27]. The y-axis represents the results of the hypergeometric test in permuted p values (−log10). The horizontal grey dashed line marks the 5% significance threshold. T2D, type 2 diabetes; DE, definitive endoderm; GT, primitive gut tube; PF, posterior foregut; PE, pancreatic endoderm; EP, endocrine precursor; EN, endocrine-like cells; BLC, beta-like cells

