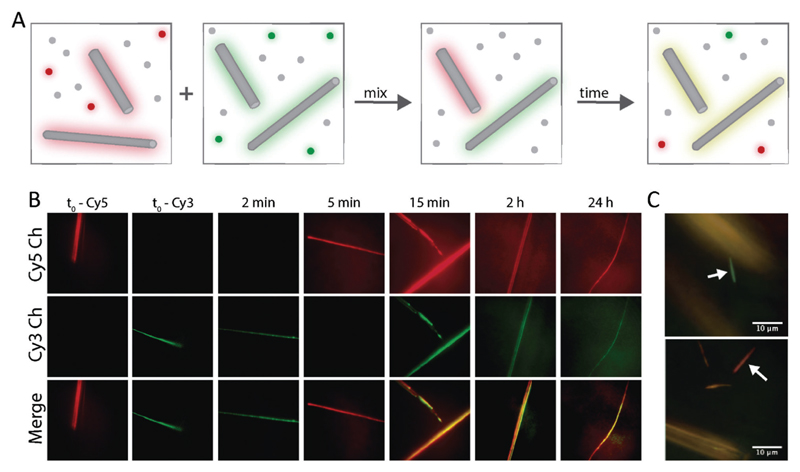
Fig. 3.
(A) Schematic representation of the imaging experiment to probe assembly dynamics. (B) Fluorescent images of FF assemblies at different time points in the Cy3 (green) and Cy5 (red) channels. (C) Representative images showing co-existence of fully exchanged fibers (yellow) and kinetically trapped fibers (red or green, see arrows).

