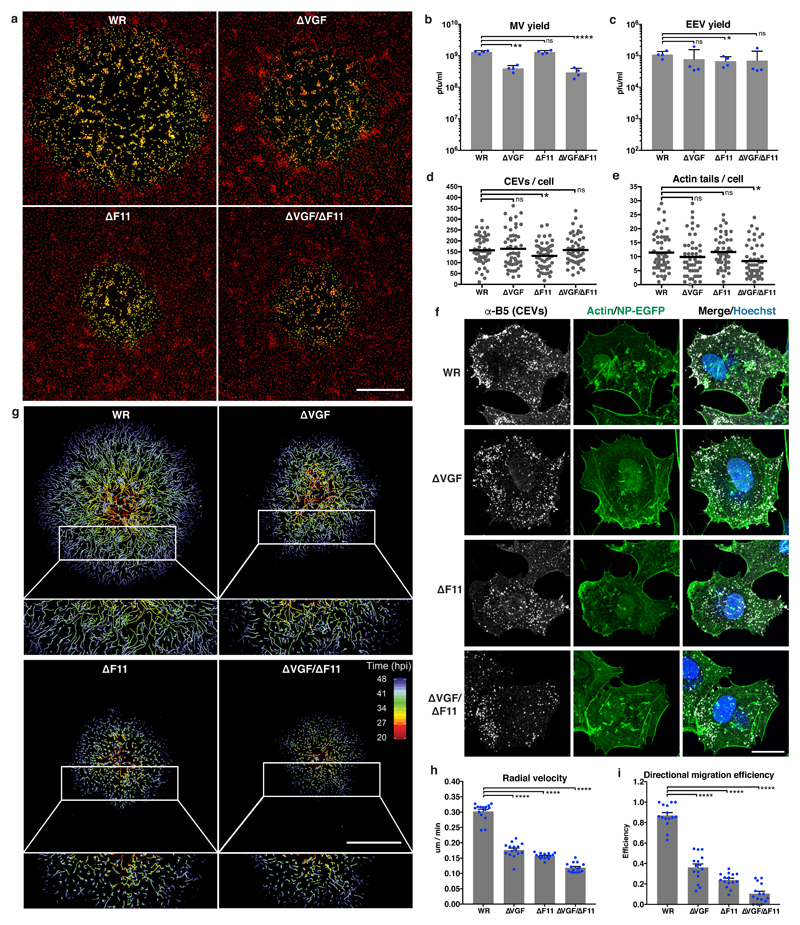
Figure 1. VGF is required for VACV-induced cell motility and virus spread.
a, Plaque formation by VACV WR and mutants (ΔVGF, ΔF11 and ΔVGF/ΔF11). Nuclei (red) and infected cells (green). b, c, 24 h MV and EEV yields from WR and mutant VACVs. d, e, CEVs and actin tails per cell during WR and mutant VACV infections. f, Representative images of cells infected with WR or VACV mutants for 10 h. g, Single cell tracking of WR and mutant VACV plaque formation (20 - 48 hpi). Tracks are colour-coded by time (hpi). h,i, The radial velocity and directional migration efficiency of cells migrating from the centre of plaques in g. Data represents 3 or more biological replicates (a-i). Images are representative of 3 biological replicates (a, f, g). Scale bars are 500 μm (a, g) or 20 μm (f). Bars represent means + SD (b, c), or means + SEM of n=5 plaques per condition/replicate (h, i). Lines represent means of 15-20 cells per condition/replicate (d, e). Paired (b, c) or unpaired (d, e, h, i) t-test was applied (**** P< 0.0001, ** P< 0.01, * P< 0.05, ns = not significant). See Supplementary Table 1 for exact statistics.

