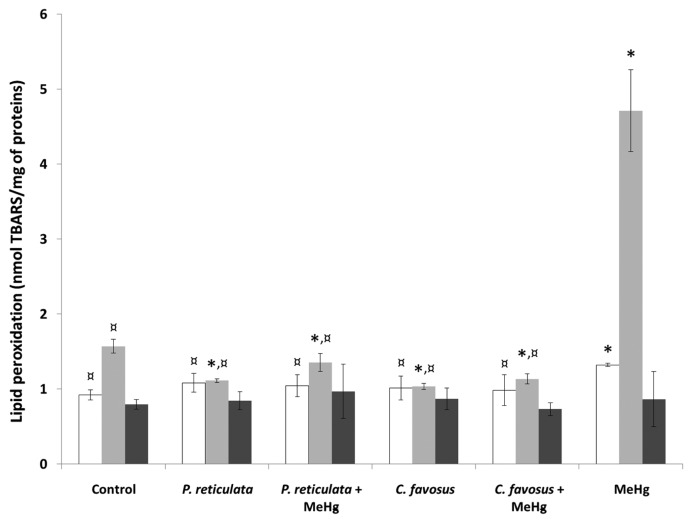
Fig. 2.
Assessment of the lipid peroxidation in the brain (white bars), the liver (light grey bars) and the skeletal muscle (dark grey bars) of zebrafish exposed to different diets during 60 days. Values are presented as mean ± SD (n = 3). *Significantly different from the control group (*p < 0.05). ¤Statistical difference as compared to the MeHg exposure condition (¤p < 0.05). In the “P. reticulata” and “C. favosus” exposure conditions fish were fed with control food supplemented with 0.5% of either the P. reticulata or the C. favosus extract. In the exposure conditions “P. reticulata+MeHg” and “C. favosus +MeHg”, the food was spiked with 13.5 μg MeHg/g d.w. and supplemented with 0.5% of either the P. reticulata or the C. favosus extract. In the exposure condition called “MeHg”, fish were fed with contaminated food containing 13.5 μg MeHg/g d.w.

