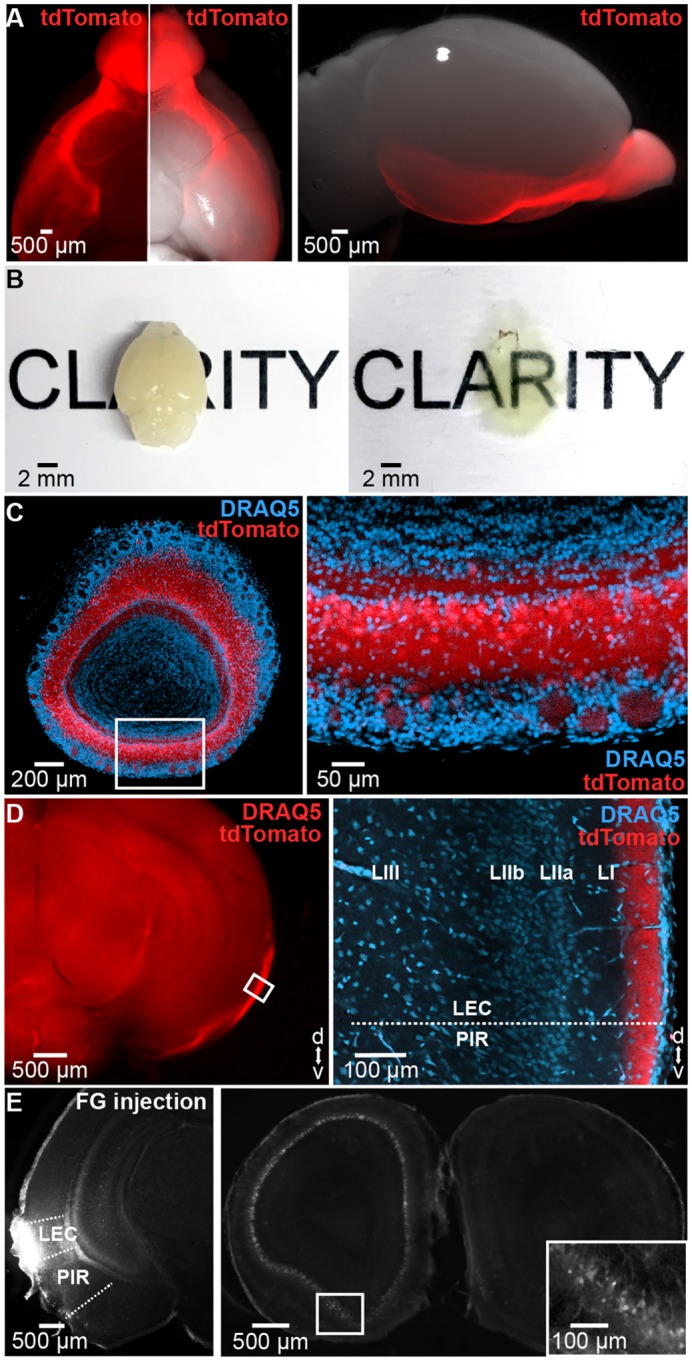
Fig 1. Bottom-up connectivity between OB and LEC in neonatal mice.

(A) Long-range projections of tdTomato fluorescently labeled OB MTCs (left) when superimposed on a bright-field image showing the ventral (middle) and lateral (right) view of the whole brain of a P10 Tbet-cre;tdTomato mouse. (B) Unprocessed (left) and cleared (right) brain of a P10 mouse. (C) Cleared 500 μm–thick coronal section containing the OB of a Tbet-cre;tdTomato mouse showing MTCs (red) when counterstained with the nuclear marker DRAQ5 (blue). Inset, tdTomato-stained MTCs displayed at larger magnification. (D) MTC axons targeting LEC in a cleared 1 mm–thick coronal brain slice. Inset, axons of tdTomato-expressing MTCs when counterstained with DRAQ5 (blue) and displayed at larger magnification. (E) Photographs of a 100 μm–thick coronal section from a P8 mouse depicting retrogradely labeled neurons in the OB (right) after injection of FG into the LEC (left) at P3. Inset, FG-labeled MTCs displayed at larger magnification. FG, Fluorogold; LEC, lateral entorhinal cortex; MTC, mitral and tufted cell; OB, olfactory bulb; P, postnatal day; PIR, piriform cortex.
