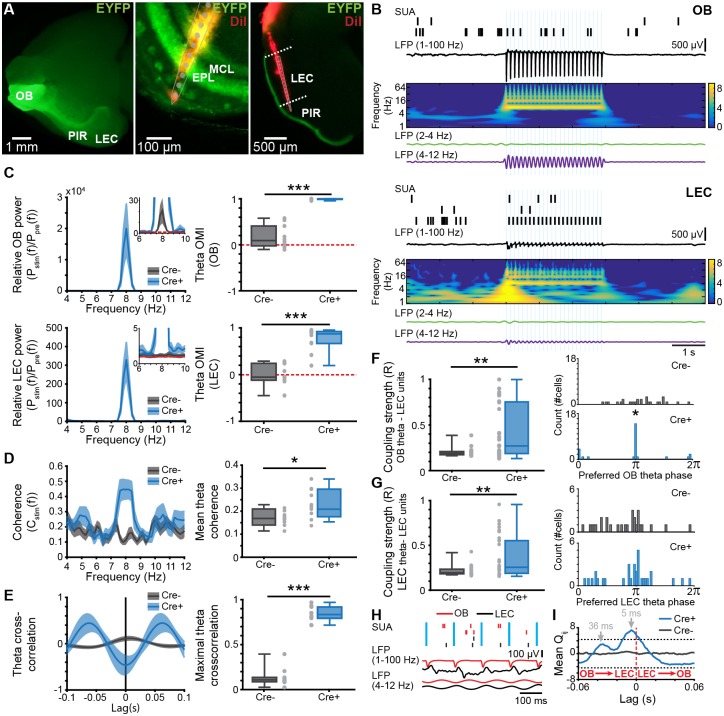
Fig 7. Effects of rhythmic optogenetic MTC activation on LEC oscillatory activity and single-unit entrainment.
(A) Left, photograph of the ventral side of a brain from a P8 Cre+ Tbet-cre mouse showing EYFP-fluorescent MTC bodies in OB and their projections reaching PIR and LEC. Middle, photograph of the DiI-labeled optrode track into a 100 μm–thick coronal section of the OB from a P8 Cre+ Tbet-cre mouse. Right, photograph of the DiI-labeled electrode track into a 100 μm–thick coronal section of the LEC from a P8 Cre+ Tbet-cre mouse. (B) Spike trains from clustered units recorded simultaneously with the band-pass filtered (1–100 Hz, RR 2–4 Hz, theta 4–12 Hz) LFP in response to pulsed light (blue, 473 nm) stimulation of MTCs in OB (top) and LEC (bottom) of a P8 Cre+ Tbet-cre mouse. Traces are accompanied by the color-coded wavelet spectrograms of LFP shown at identical timescale. (C) Left, power spectra showing the relative LFP power change in OB (top) and LEC (bottom) after pulsed (8 Hz) light stimulation of MTCs in Cre− and Cre+ mice. Inset, power spectra shown at higher magnification. Right, box plot showing OMI of theta power in OB (top) and LEC (bottom) of Cre− and Cre+ mice (OB: p = 0.0002, LEC: p = 0.0004, Wilcoxon rank-sum test). For all plots, the red dotted line corresponds to unchanged power. (D) Left, plots of imaginary coherence between OB and LEC during pulsed (8 Hz) light stimulation of MTCs in Cre− and Cre+ mice. Right, box plot displaying mean theta coherence during light stimulation of MTCs (p = 0.021, Wilcoxon rank-sum test). (E) Left, plots of cross-correlation between OB and LEC during light stimulation of MTCs in Cre− and Cre+ mice. Right, box plot showing maximal cross-correlation during light stimulation of MTCs (p = 0.0002, Wilcoxon rank-sum test). (F) Left, coupling strength calculated as mean resultant vector length for LEC units to the OB theta rhythm during light stimulation of MTCs in Cre− and Cre+ mice (p = 0.0055, Wilcoxon rank-sum test). Right, histograms showing the phase preference of LEC units (p = 0.01, Kuiper two-sample test). (G) Same as (F) for LEC units to LEC theta phase. (H) Spike trains in relationship to LFP in OB and LEC. Note the presence of both short and long delays between spikes from the two areas. (I) Mean standardized spike–spike cross-covariance of significant OB–LEC unit pairs from Cre+ mice (n = 27 pairs) and Cre− mice (n = 61 pairs). Black dashed lines indicate the significance threshold. A negative time lag corresponds to OB → LEC. Data are available in S1 Data. EPL, external plexiform layer; EYFP, enhanced yellow fluorescent protein; LEC, lateral entorhinal cortex; LFP, local field potential; MC, mitral cell; MTC, mitral and tufted cell; OB, olfactory bulb; OMI, optogenetic modulation index; P, postnatal day; PIR, piriform cortex; RR, respiration-related rhythm; SUA, single-unit activity.

