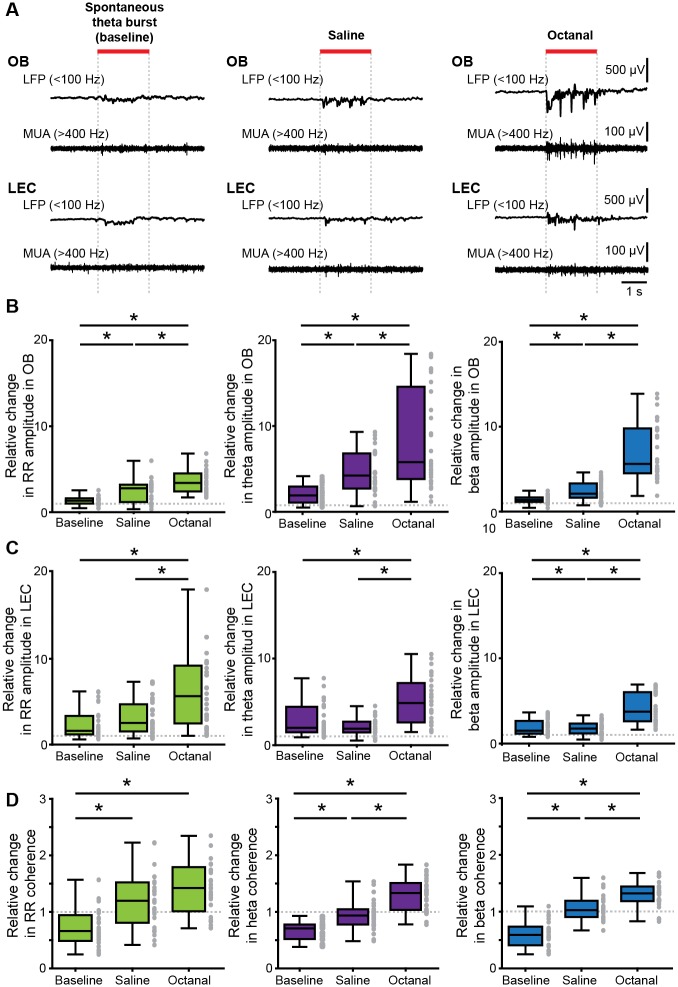
Fig 8. Odor-triggered activity patterns in OB and LEC of neonatal mouse.
(A) Characteristic LFP traces (band-pass filtered 1–100 Hz) recorded in OB (top) and LEC (bottom) of a P9 mouse before (baseline, left) and after application of odors (saline, middle; octanal, right) displayed together with simultaneously recorded MUA. (B) Box plots showing odor-evoked changes in the amplitude of RR (left), theta (middle), and beta (right) activity in OB when normalized to baseline. (C) Same as B for LEC. (D) Box plots showing odor-evoked relative changes in OB–LEC coherence in RR (left), theta (middle), and beta (right) band when normalized to baseline. Gray dots correspond to individual trials (Kruskal-Wallis test, Wilcoxon rank-sum test with Bonferroni correction as post hoc test, *p < 0.0167). Data are available in S1 Data. LEC, lateral entorhinal cortex; MUA, multiunit activity; OB, olfactory bulb; P, postnatal day; RR, respiration-related rhythm.

