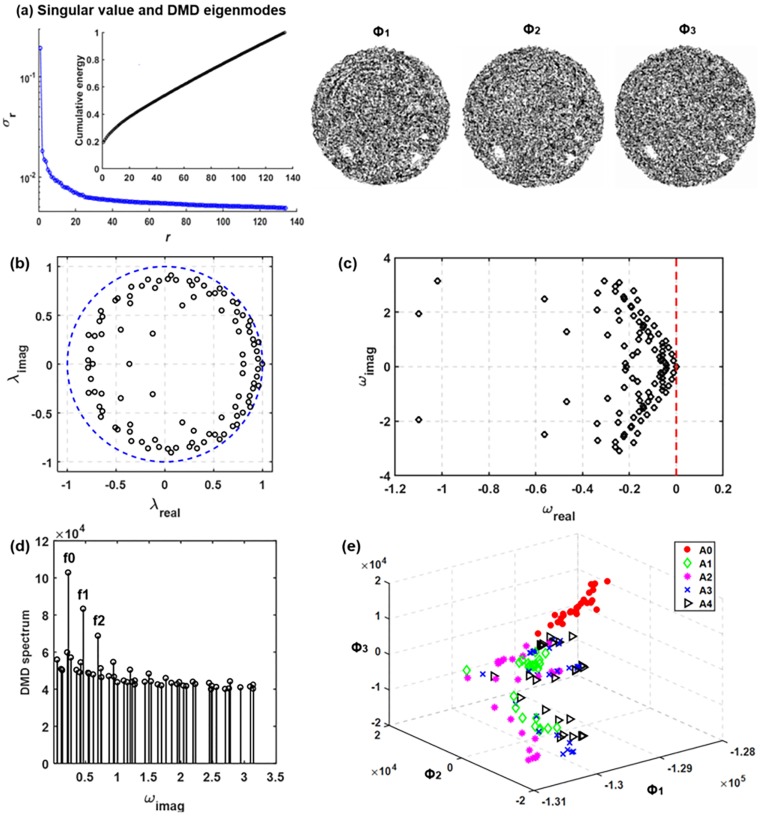
Fig 8.
DMD eigenvalues and energy spectrum of the exhaled aerosol images: (a) discrete eigenvalues λ relative to the unit circle (blue dashed line) and (b) the transformed eigenvalues calculated as ω = log(λ)/(2π). The phase velocity ωi is normalized by 2π to reveal the frequency information. The DMD spectrum is shown in (d) and the projection of dataset onto the first three DMD modes are shown in (e).

