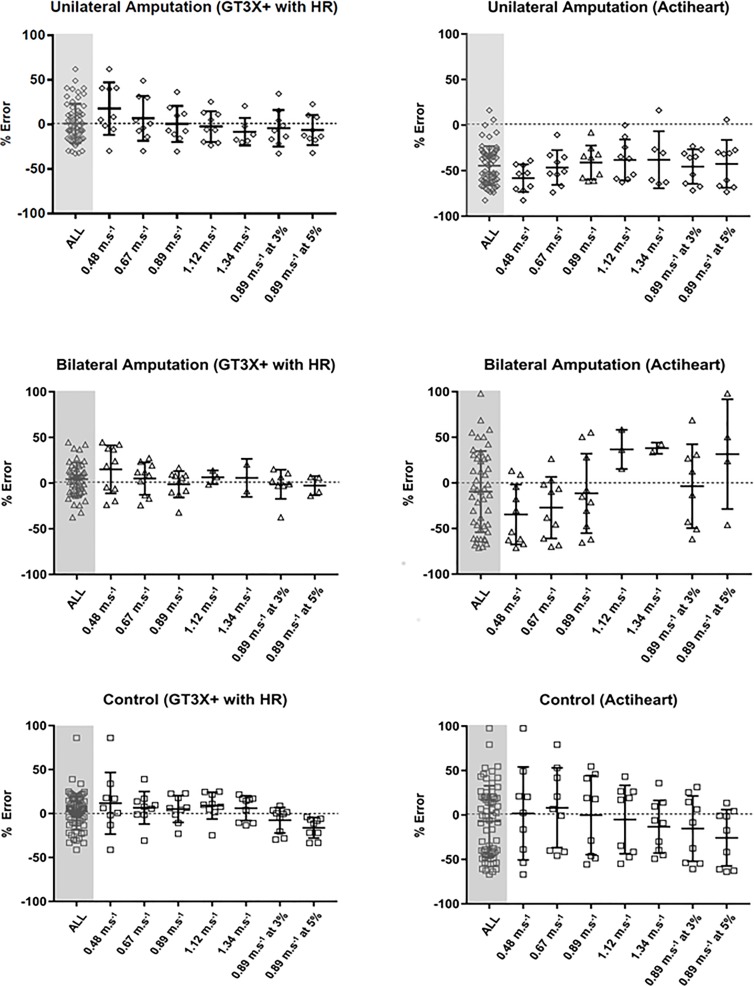
Fig 3.
Modified box and whisker plots demonstrating the mean percentage error of estimation relative to criterion for each treadmill activity using GT3X+ with heart rate estimation models (A, C, E), and Actiheart (B, D, F). The plots show the unilateral group (A, B), bilateral group (C, D) and control group (E, F).

