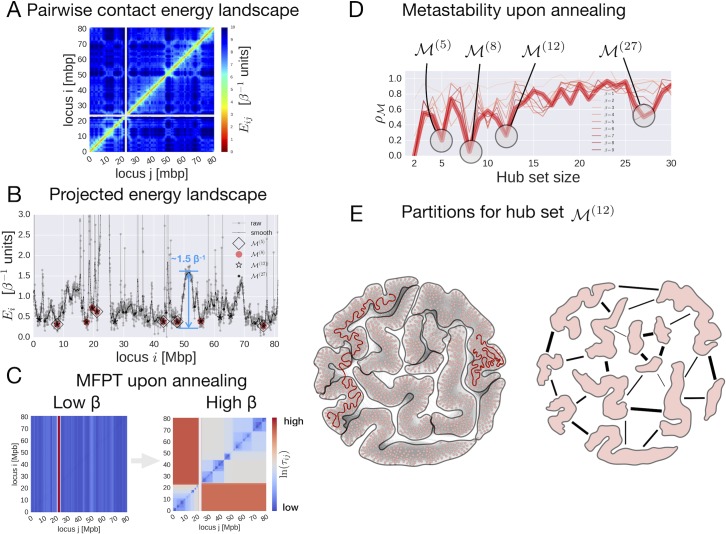
Fig 2. Analysis of human chromosome 17 using a MSM-based computational framework.
(A) Pairwise contact energy landscape of human chromosome 17. (B) 1D projection of the chromosome 17 energy landscape. (C) Effect of annealing on the mean-first passage time (MFPT) between loci. (D) Optimization of the metastability index under different annealing conditions (β = 1 to 9). (E) Partitioning of chromosome 17 determined by the hub set (left, visualization obtained by the Fruchterman-Reingold visualization algorithm implemented in Gephi [60]) and schematic illustration of the effective interactions between 12 observed partitions (right).

