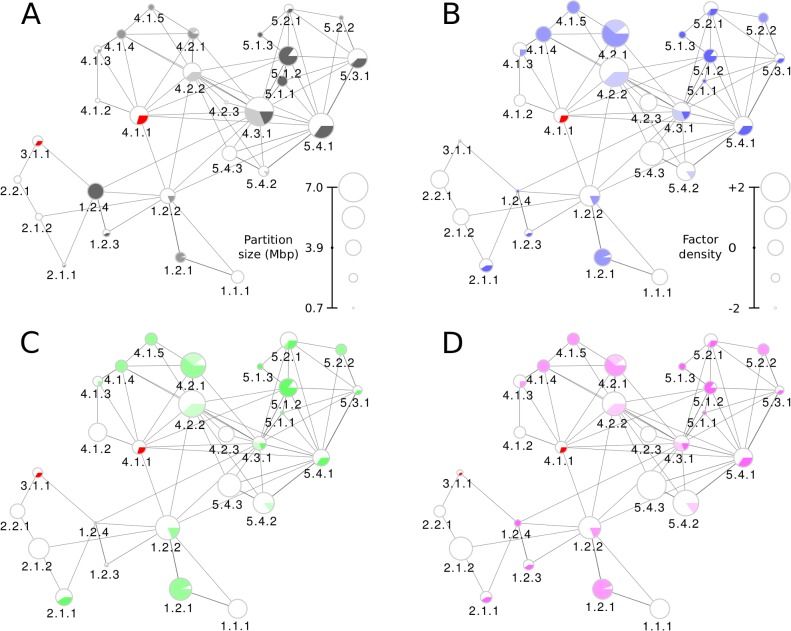
Fig 4. Distribution of epigenetic factors in partitions of chromosome 17 at the third level of structural hierarchy.
Partitions are represented as pie-charted nodes depicting the presence of eu- and heterochromatin (on the basis of Giemsa-staining) within the partition. The node sizes are set according to the partition size or Z-scored density of the factor in the corresponding partitions (see scales in corresponding panels). Edge widths correspond to effective interaction strengths, while node sizes in each panel represent the (A) partition size, and factors’ Z scores for (B) CTCF, (C) H3K9ac, and (D) DNase-Seq epigenetic factors. Visual legends show how the values corresponding to each partition scale with the node size.

