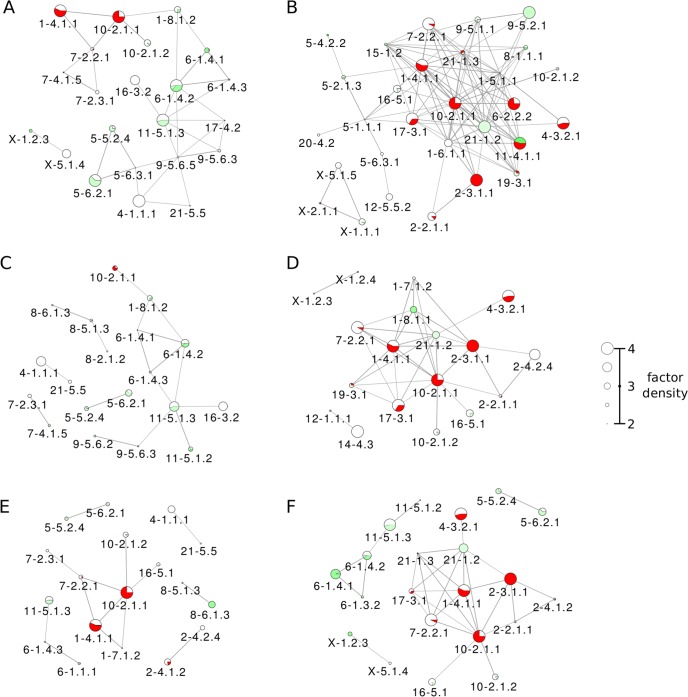
Fig 8. High-affinity clusters enriched in various histone modifications.
Node sizes represent the factor Z scores, and edge widths represent affinity values. The following histone modifications are considered; (A) H3K9ac, (B) H3K9me3, (C) H3K27ac, (D) H3K27me3, (E) H3K4me1, and (F) H3K4me3. In each case, only partitions with factor Z-scores above 2 and only edges connecting partition pairs with high affinity C > 2 are shown.

