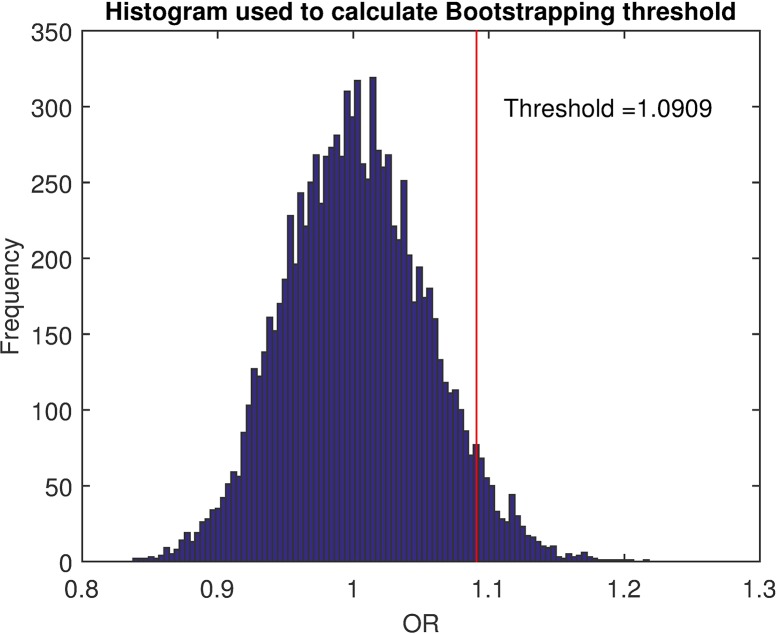
Fig 5. Determination of the O.R. threshold used to discriminate between chemotaxis and no chemotaxis in the bootstrapping method.
The histogram comes from 10000 O.R. ratios, each one calculated by the odds value of two disjointed subsets of trajectories randomly sampled over all detected trajectories in 100 control simulations. Each simulation consisted of a 500 frames length video (800x800 pixels each frame) containing 100 virtual cells randomly located at the beginning of the simulation. Each cell was defined as an ellipse (10x8 pixels size) and behaved following a persistent random walk equation with parameters Drot = 0.1, v0 = 3,β = 0, Reponsiveness = 0 and ψ0 = 0°.

