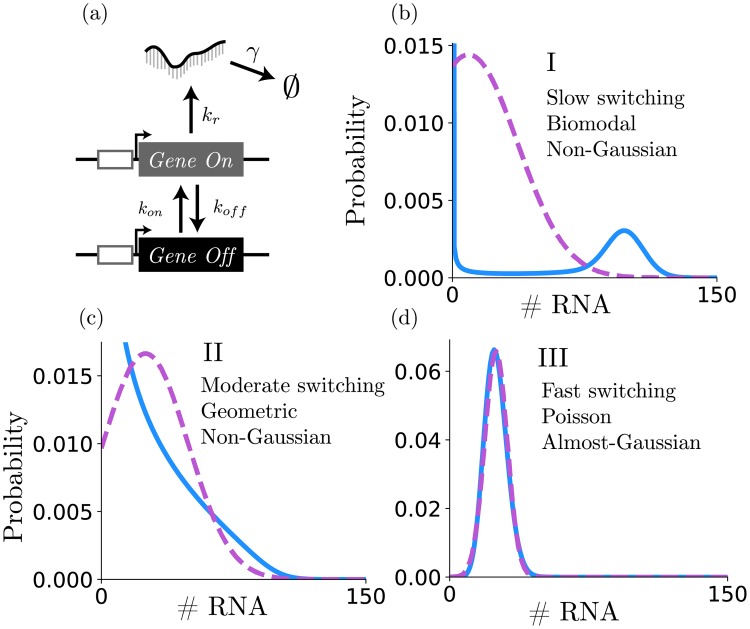
Fig 2. Bursting gene expression.
(a) Schematic of the standard bursting gene expression model. Parameters are defined as given in the text to yield an “on” fraction of 0.25 and a mean expression of 25 mRNA per cell. (b) At slow switching rates, unique “on” and “off” modes are apparent, and distributions of molecule numbers are bimodal. (c) For intermediate switching rates, the distributions are geometric. (d) At high switching rates, the distributions are nearly Poisson (d). For each switch rate scale (labeled I, II, or III), the distribution of RNA computed with the FSP (blue) is compared to a Gaussian with the same mean and variance (purple).

