Figure 7.
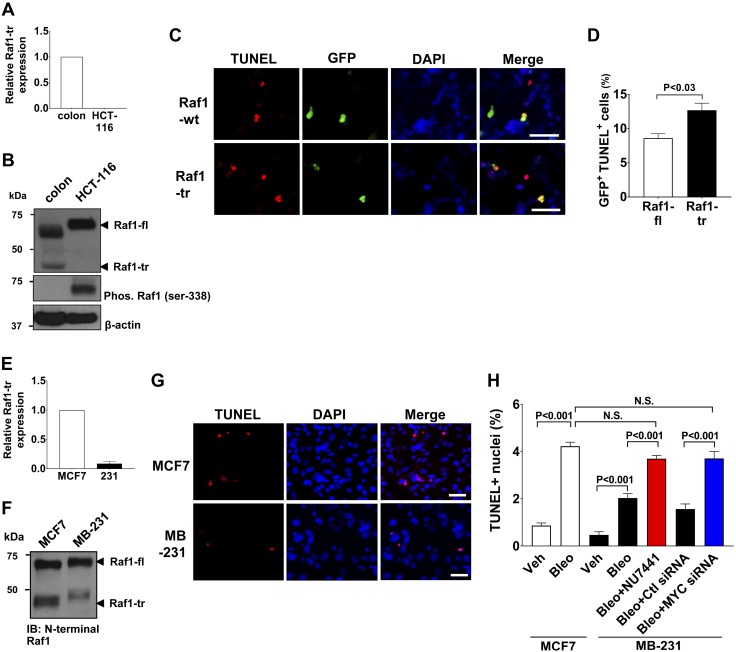
Raf1-tr increases the apoptotic response of cancer cells exposed to DNA damage. A) Measurement of Raf1-tr gene expression in colon tissue and the HCT-116 colorectal carcinoma cell line. The gene of interest was normalized to GAPDH expression and represented as fold change relative to colon tissue. B) Western blot of Raf1 in colon and HCT-116 lysate showing that Raf1-tr protein expression is absent in HCT-116 cells. Phosphorylation of Raf1-fl in HCT-116 cells results in a slower migrating species compared with normal colon. C) TUNEL stain (red) of HCT116 cells expressing Raf1-fl or Raf1-tr exposed to 0.150 mg/ml bleomycin for 72 h. Transfected cells were identified by coexpression of Raf1-fl or Raf1-tr and GFP (green) using IRES. Nuclei were counterstained with DAPI (blue). D) Quantitation of GFP-positive apoptotic cells. A minimum of 250 cells per group were analyzed. E) Measurement of Raf1-tr gene expression in MCF7 and MB-231 mammary adenocarcinoma cell lines. The gene of interest was normalized to GAPDH expression and represented as fold change relative to MCF7 cells. F) Western blot of Raf1 in MCF7 and MB-231 cell lysate demonstrating decreased Raf1-tr expression in MB-231 cells relative to MCF7 cells. G) TUNEL stain (red) of MCF7 and MB-231 cells exposed to 0.05 mg/ml bleomycin for 72 h. Nuclei were counterstained with DAPI (blue). H) Quantitation of TUNEL-positive nuclei in MCF7 cells exposed to vehicle (Veh) or bleomycin (Bleo) compared with MB-231 cells exposed to Veh alone, Bleo alone, Bleo + DNA-PK inhibitor NU7441 (0.5 μM) and Bleo + control (Ctl) or MYC siRNA (25 nM). A minimum of 250 cells per group were analyzed. The results are shown as means ± sem. N.S., not significant. Scale bars, 50 µm. Images are representative of experiments run in triplicate.

