Figure 5.
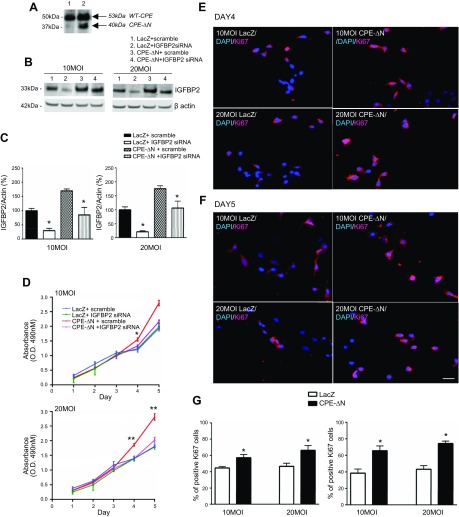
CPE-∆N increased proliferation in HT22 cells via up-regulation of IGFBP2. A) Western blot showing enhanced expression of CPE-∆N in HT22 cells transduced with 10 MOI of virus (lane 2) vs. control cells (lane 1). B) Western blot showing expression of IGFBP2 in HT22 cells transduced with 10 and 20 MOI CPE-∆N virus. CPE-∆N transduced at both 10 and 20 MOI enhanced IGFBP2 protein levels, whereas IGFBP2 siRNA significantly reduced the protein expression of IGFBP2. C) Bar graphs showing the quantification of the Western blots in B. D) MTT assay for proliferation. CPE-∆N transduced at 10 and 20 MOI increased proliferation on d 4 and 5; that effect was blocked by IGFBP2 siRNA. One-way ANOVA with Tukey’s post hoc test. *P < 0.05, **P < 0.01, compared with controls. E, F) Immunocytochemistry of Ki-67 (the nuclear marker for cell proliferation)-positive cells in CPE-∆N transduced mouse primary cortical neurons. Scale bar, 100 μm. G) Bar graphs showing that CPE-∆N transduced at 10 and 20 MOI increased Ki-67+ cells on d 4 and 5 compared with control. Values are means ± sem. Student’s t test, n = 3. *P < 0.05, compared with control.

