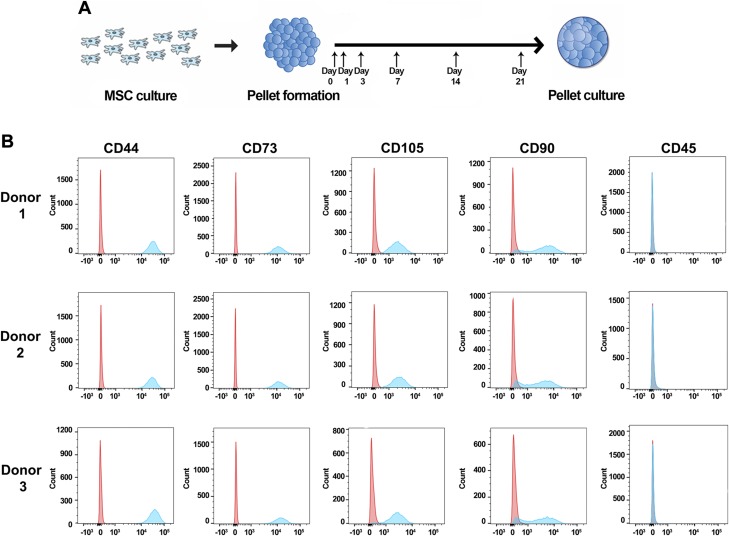
Figure 1.
Distribution of MSC surface markers. A) Experimental design. MSCs were formed into pellets after passage 4 and cultured under chondrogenic conditions for up to 21 d. Pellets were collected at d 0, 1, 3, 7, 14, and 21. B) Representative histograms from 3 donors. Control samples stained with isotypes are depicted in red; samples stained with surface markers are depicted in blue.

