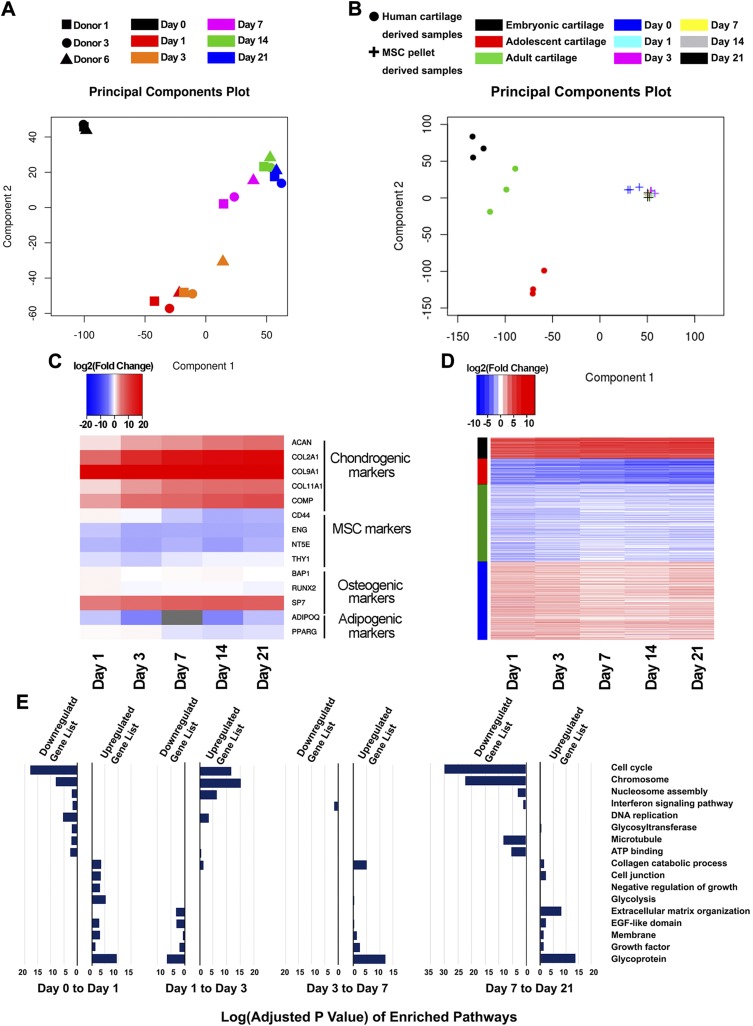
Figure 3.
Differential expression (DE) analysis. A) PCA of 18 MSC-derived pellet samples. Samples were closely related by days, and there was minor donor-to-donor variation. B) PCA of MSC-derived pellet samples vs. human cartilage at different developmental stages. C) Expression patterns of MSC markers and markers of potential lineages. Gene expression was represented as log2 fold change compared to d 0 samples. D) K-means clustering grouped DE genes into 4 patterns. Gene expression was represented as log2 fold change compared to d 0 samples. E) Bar graphs of enriched pathways from gene ontology analysis. Datasets for human cartilage were retrieved using GEO accession number GSE106292 (79).

