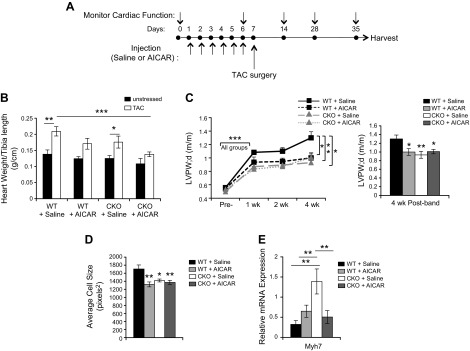
Figure 5.
AICAR injections blunt hypertrophic response to TAC. A) Schematic of experimental time line for AICAR injections, TAC surgery, and cardiac monitoring performed on WT and SRC-2–CKO mice. B) Hearts were excised, weighed, and compared with tibia length. Before surgery: n = 4 (WT + saline), n = 5 (WT + AICAR), n = 7 (CKO + saline), and n = 6 (CKO + AICAR); after surgery: n = 8 (WT + saline), n = 6 (WT + AICAR), n = 6 (CKO + saline), and n = 10 (CKO + AICAR) C) Echocardiography measurements of left ventricular posterior wall thickness in diastole (LVPWd). Right: 4-wk time point (n = 5 − 18; see Table 1 for n at each time point). WT + saline data after TAC have been previously published (28). D) Average cardiomyocyte size calculated from cross sections of left ventricles stained with WGA; ≥4 sections/animal with >100 cells/section were analyzed; n = 7–10. WT + saline data after TAC have been previously published (28). E) qPCR for Myh7 expression in total heart RNA from left ventricular sections 4 wk after TAC surgery. Expression is normalized to GAPDH. n = 3–4 Results are presented as the means ± sem analyzed by 2-way ANOVA with multiple comparisons and with a Tukey’s post hoc analysis. *P ≤ 0.05, **P ≤ 0.01, ***P ≤ 0.001.

