Figure 5.
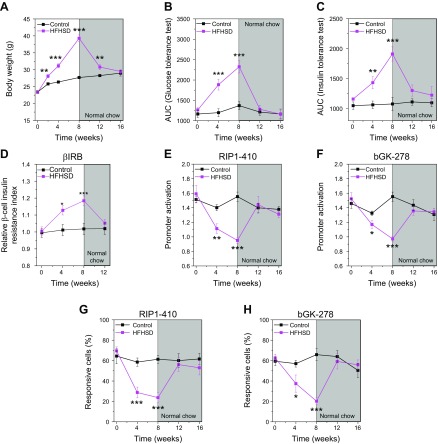
βFLUOMETRI reveals loss of functional β-cell mass in response to HFHSD and the regaining of function upon recovery from the diet. A) Body weight of B6 mice before, during, and after feeding of a control diet or HFHSD (n = 5–10). B) Glucose tolerance obtained by IPGTT and depicted as the AUC of the IPGTT in B6 mice before, during, and after feeding of a control diet or HFHSD (n = 5–10). C) Whole-body insulin resistance obtained by IPITT and depicted as the AUC of the IPITT in B6 mice before, during, and after feeding of a control diet or HFHSD (n = 5–10). D) Relative β-cell insulin resistance indicated by βIRB in islets transplanted into the ACE in mice before, during, and after feeding of a control diet or HFHSD (n = 12–20). E) RIP1-410 promoter activation indicated by the βFLUOMETRI and obtained in vivo in transduced islets transplanted into the ACE of B6 mice before, during, and after feeding of a control diet or HFHSD (n = 5–10). F) bGK-278 promoter activation indicated by the βFLUOMETRI and obtained in vivo in islets transplanted into the ACE of B6 mice before, during, and after feeding of a control diet or HFHSD (n = 5–10). G) Proportion of glucose-responsive cells indicated by RIP1-410 of the βFLUOMETRI and obtained in vivo in islets transplanted into the ACE of B6 mice before, during, and after feeding of a control diet or HFHSD (n = 5–10). H) Proportion of glucose-responsive cells indicated by bGK-278 of the βFLUOMETRI and obtained in vivo in islets transplanted into the ACE of B6 mice before, during, and after feeding of a control diet or HFHSD (n = 5–10). *P < 0.05, **P < 0.01, ***P < 0.001. Data are expressed as means ± sem.

