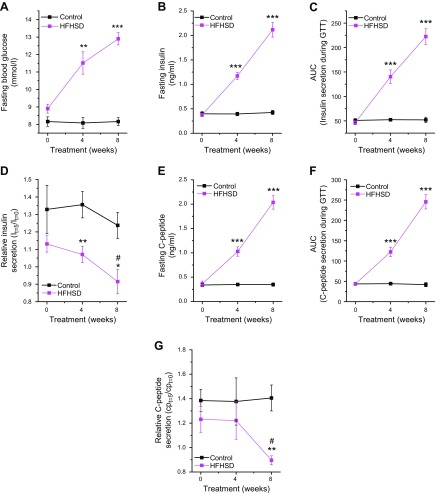
Figure 6.
HFHSD leads to noncompensatory insulin secretion. A) Fasting blood glucose in mice fed a control diet or HFHSD. B) Fasting insulin in mice fed a control diet or HFHSD. C) Insulin secretion during an IPGTT in mice fed a control diet or HFHSD. D) Relative insulin secretion during the first 5 min of an IPGTT in mice fed a control diet or HFHSD. E) Fasting C-peptide results in mice fed a control diet or HFHSD. F) C-peptide secretion during an IPGTT in mice fed a control diet or HFHSD. G) Relative C-peptide secretion during the first 5 min of an IPGTT in mice fed a control diet or HFHSD. n = 5–6. *P < 0.05, **P < 0.01, ***P < 0.001 for control diet vs. HFHSD; #P < 0.01 for HFHSD at 8 wk of treatment vs. 0 wk of treatment. Data are expressed as means ± sem. See also Supplemental Fig. S4.

