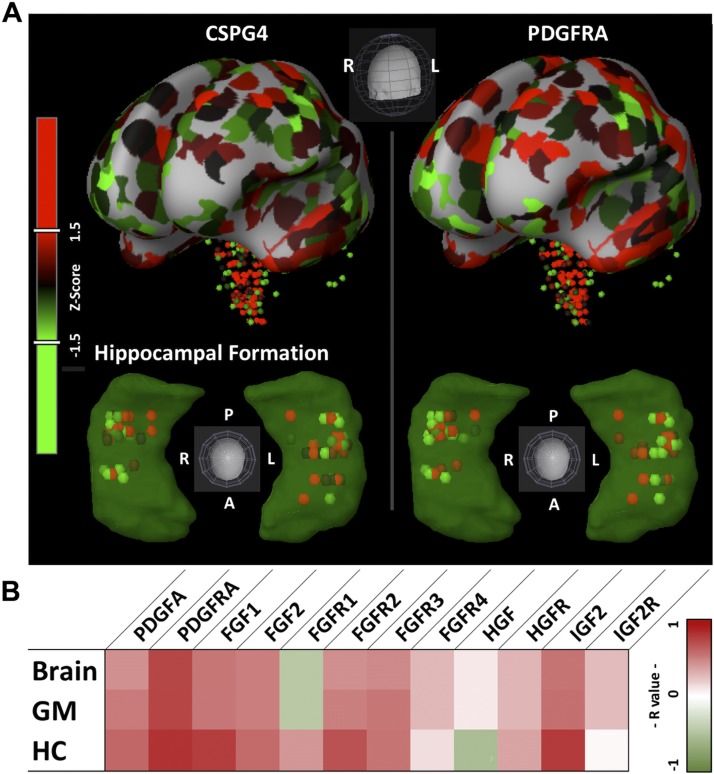
Figure 1.
CSPG4 spatial expression correlation. A) Brain Explorer 2 (v.2.3.5) images of microarray sample locations and z-score (patches or globes; red high, green low) intensities for representative specimen H0351.2001. Whole brain is shown in the top row; hippocampal formation of the above whole brain and genes shaded in green are shown in the lower row. Color bar indicates z score from Brain Explorer 2. B) Heat map (red high, green low) showing R values for gene probes of interest within the brain, gray matter (GM), and hippocampus (HC). Color bar and color map are from Microsoft Excel conditional formatting tool with 3 colors (r = 1 dark red, r = 0 white, r = −1 dark green).

