Figure 2.
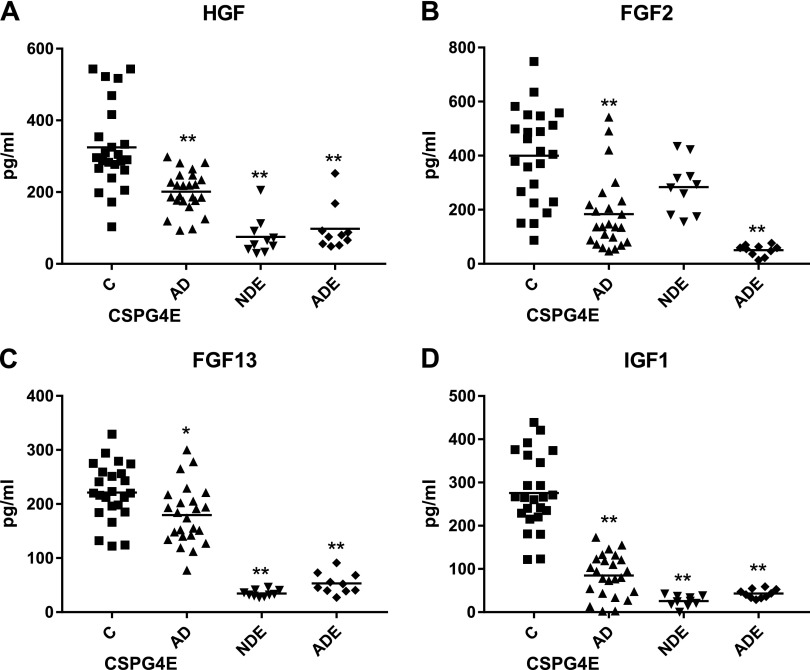
CSPG4 cell–derived exosome levels of growth factors in cross-sectional control and AD groups. Each point represents value for 1 subject, and horizontal line in point clusters depicts mean level for that group. Data depicted are for HGF (A), FGF-2 (B), FGF-13 (C), and IGF-1 (D). Mean ± sem values for control subject and AD patient CSPG4Es, and for NDEs and ADEs of same control subjects, respectively, are 325 ± 24.4 and 201 ± 11.5 pg/ml, and 75.1 ± 16.6 and 97.8 ± 20.3 pg/ml for HGF; 399 ± 35.1 and 184 ± 27.7 pg/ml, and 284 ± 30.6 and 50.3 ± 6.41 pg/ml for FGF-2; 222 ± 10.8 and 180 ± 11.1 pg/ml, and 34.6 ± 1.97 and 53.2 ± 6.07 pg/ml for FGF-13; 136 ± 13.1 and 84.9 ± 9.98 pg/ml, and 25.5 ± 4.05 and 42.9 ± 3.22 pg/ml for IGF-1. Significance of differences between levels for control subjects and AD patients was calculated by unpaired Student’s t test; *P ≤ 0.01, **P < 0.0001.

