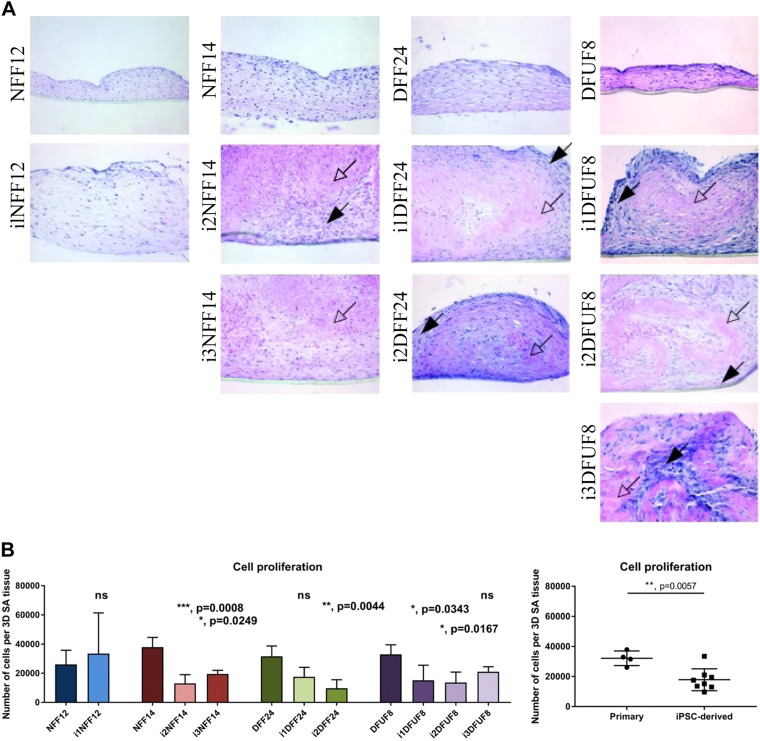
Figure 5.
The 3D in vitro SA tissues formed by iPSC-derived fibroblasts show unique tissue appearance. A) Representative images of H&E staining of 3D in vitro SA tissues produced by primary and iPSC-derived fibroblasts. B) Quantification of fibroblast proliferation in 3D SA tissues using WST-8 assay. Each iPSC-derived cell line was compared with its parent primary fibroblast cell line using 1-way ANOVA with Tukey’s correction for multiple comparisons. n = 6 for each cell line. Error bars represent sd. Primary and iPSC-derived fibroblasts were compared using Student’s t tests. P > 0.05 (not significant), *P ≤ 0.05, **P ≤ 0.01, ***P ≤ 0.001, ****P ≤ 0.0001.

