Figure 7.
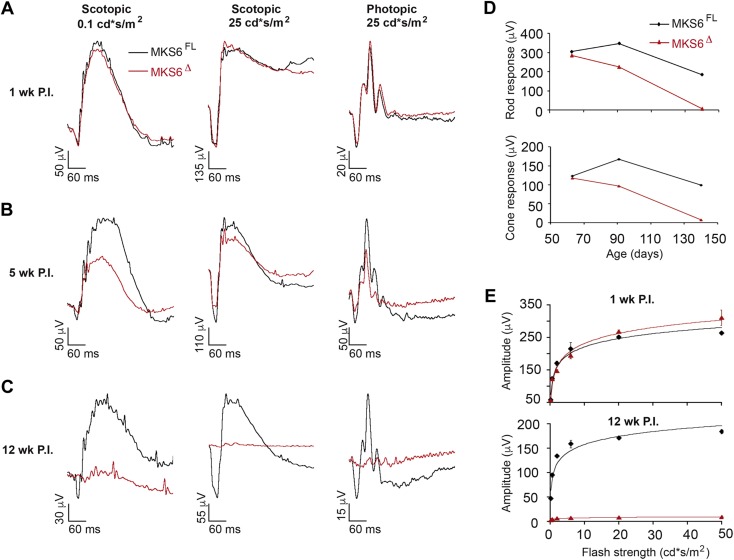
Longitudinal functional analysis of Mks6Δ retinas. A–C) Conditional loss of Mks6 results in visual deficits. Overlaid representative scotopic and photopic ERG traces at the lowest and highest flash intensities (0.1 and 25 cd ⋅ s/m2) from dark-adapted Mks6FL control (black) and Mks6Δ mutant (red) animals. Scotopic and photopic ERGs were recorded in the same cohort of animals. A) One week P.I. does not display a phenotype. B, C) Five week (B) and 12 wk (C) P.I. both display visual deficits. D) Rod and cone response summary data averaged across Mks6FL (black circles) and Mks6Δ (red circles) animals are shown over a period of 12 wk. E) Scotopic a-wave summary data averaged across Mks6FL (black circles) and Mks6Δ (red circles) at 1 wk and 12 wk P.I. a-wave amplitude was measured as baseline to trough, whereas b-wave amplitude was measured baseline to peak at each flash intensity. Mks6Δ a- and b-wave amplitudes were significantly decreased at 12 wk of age compared with Mks6FL controls. Repeated measures of ANOVA were performed, means ± sd, n = 3 per group.

