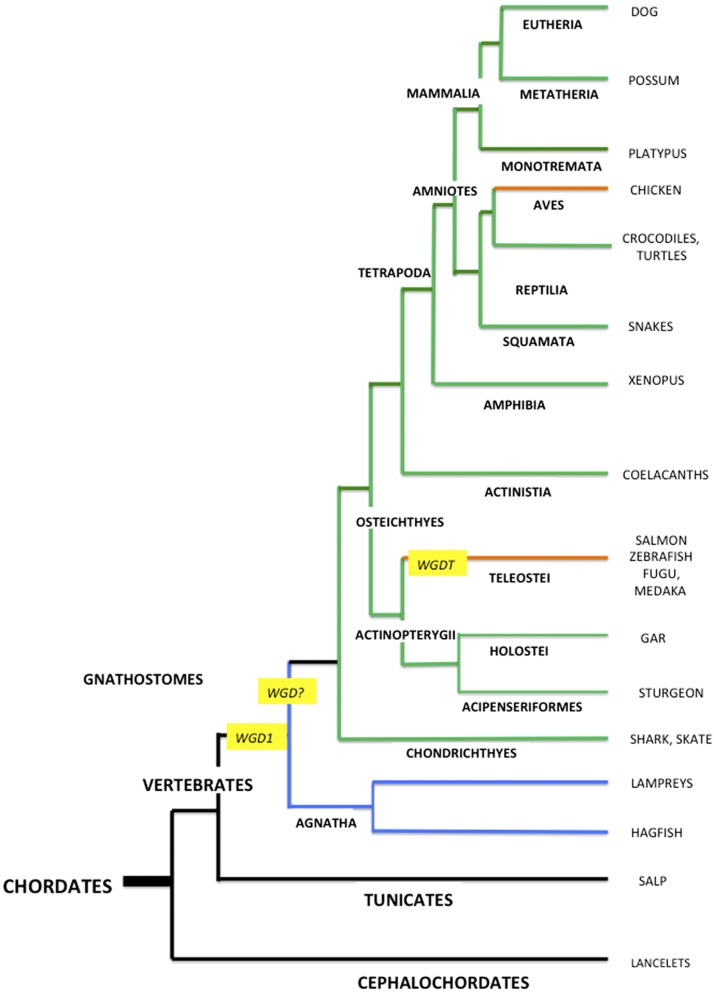
Figure 2.
A phylogenetic tree of the Chordate phylum, showing the interrelationships of some species discussed in the text and positioning of WGDs. Black lines represent invertebrate lineages; green lines, lineages with the 4 vertebrate TIMPs; orange lines, lineages lacking TIMP1; and blue lines, the Agnatha, which appear to have undergone 1 or 2 TIMP gene duplication events. The figure is based on Fig. 6 from Nakatani et al. (33).

