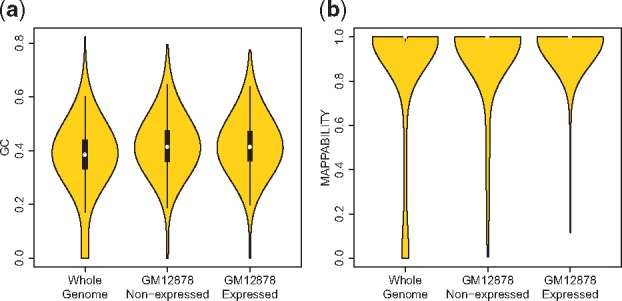
Fig. 4.

Violin plots for (a) GC of randomly sampled intervals from human genome, GC of intervals of GM12878 non-expressed genes and expressed genes. (b) Mappability of randomly sampled intervals from human genome, mappability of intervals from non-expressed and expressed gene-sets of GM12878
