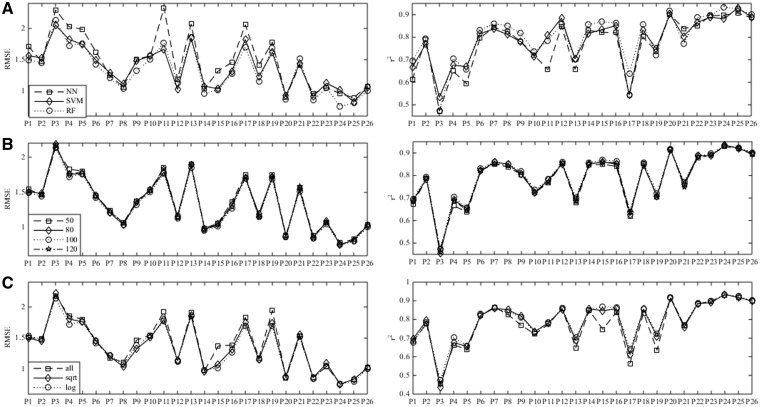
Fig. 3.
Dependence of WDL-RF performance on (A) regression models, (B) the parameter n_estimates and (C) max_features of random forest. The x-axis denotes the different GPCR datasets, i.e. P1: P08908; P2: P50406; P3: P08912; P4: P35348; P5: P21917; P6: Q9Y5N1; P7: P30968; P8: P24530; P9: Q99705; P10: P35372; P11: P46663; P12: P35346; P13: P21452; P14: P30542; P15: Q99500; P16: Q9Y5Y4; P17: P34995; P18: P51677; P19: P48039; P20: Q8TDU6; P21: Q8TDS4; P22: Q9HC97; P23: P47871; P24: P41180; P25: Q14416; P26: Q99835

