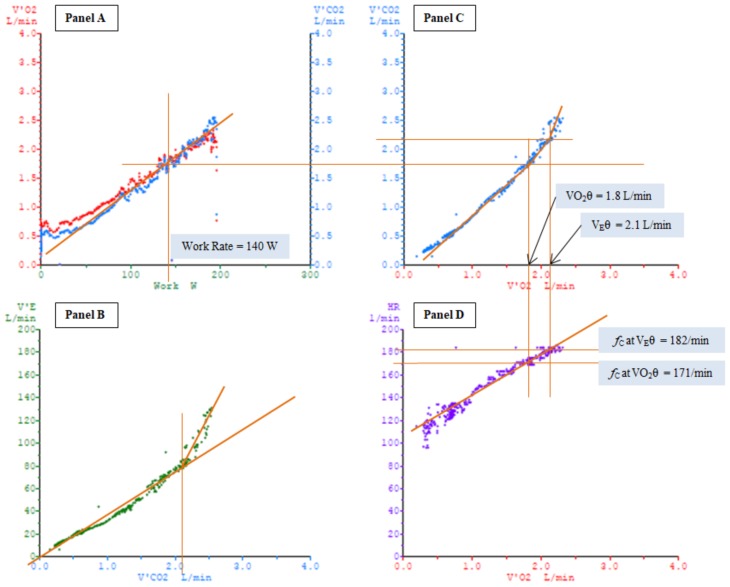
Figure 1.
Panel A: Diagrammatic representation of oxygen uptake (VO2) in red and carbon dioxide output (VCO2) in blue as a function of work. Panel B: Diagrammatic representation of minute ventilation (VE) as a function of VCO2. VCO2 was measured at the inflection point in VE. Panel C: Diagrammatic representation of VCO2 as a function of VO2. Metabolic threshold (VO2θ) was determined by measuring the VO2 at which the first inflection point in VCO2 occurred. Ventilatory threshold (VEθ) was determined by measuring the VO2 at the corresponding value for VCO2 derived from Panel B. Panel D: Diagrammatic representation of heart rate (fC) as a function of VO2. fC at VO2θ, which served as the boundary between Zone 1 and Zone 2, was determined by measuring the fC at the corresponding value for VO2 derived from Panel C. The identical process was employed to obtain the fC at VEθ, the boundary between Zone 2 and Zone 3.

