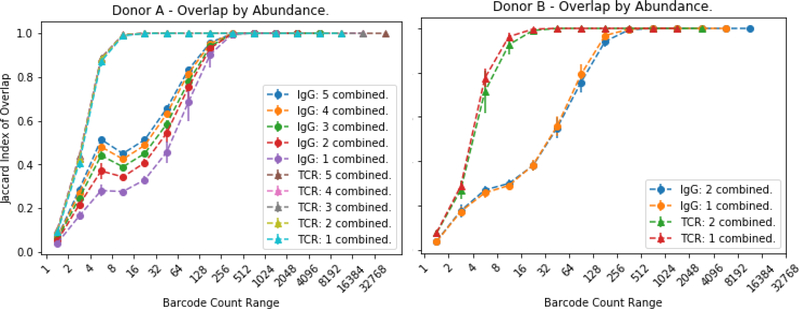
Figure 6: Group Overlap Saturation Curves.
The overlap is measured at each range of UMI with exponentially increases ranges.</p>The overlap at a range is the percent of clonotypes in that range that are present in the other library. If an overlap between ranges was taken exclusively it would miss some clonotypes with abundances differing by one. For varying subset sizes, all possible library subsets of that size are merged. Error bars indicate standard deviation.

