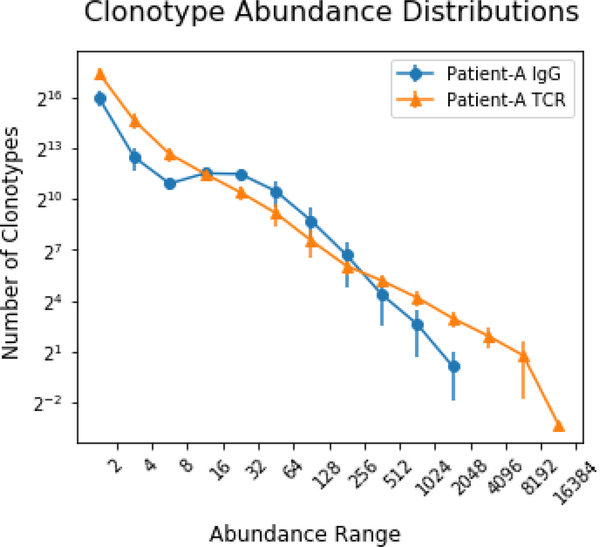
Figure 7: Clonotype Abundance Distributions:
A histogram of the number of clonotypes that are found within each barcode abundance range. Displayed for IgG and TCRbeta clonotypes and averaged across all ten libraries. The IGG clonotype distribution is skewed towards those of mid-range abundance, with significantly fewer high abundance. Error bars correspond to standard deviation.

