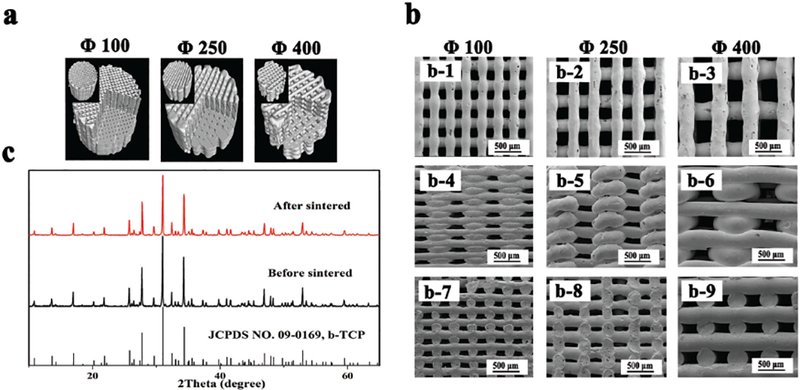
Figure 2.

β-TCP scaffold characterization. a) 3D reconstructed images of the scaffolds by micro-CT analysis. b) SEM images of porous scaffolds with a pore size of 100, 250, and 400 μm. (b-1—b-3) Top view of the corresponding scaffolds, respectively; (b-4–b-6) Side view of the corresponding scaffolds; (b-7–b-9) Cross-sectional view of the corresponding scaffolds. c) XRD patterns of the 3D-plotted scaffolds before and after sintering.
