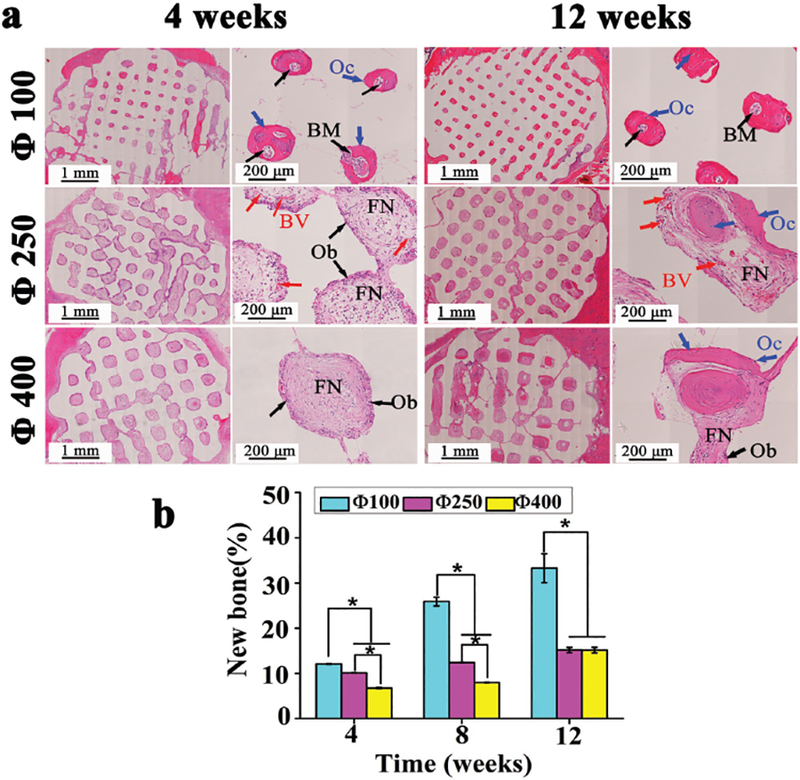
Figure 7.

Histological analysis of bone regeneration by scaffolds of different pore sizes (100, 250, 400 μm). a) H&E staining of SD rat cranial defects after implanted with three scaffolds for 4, 8, and 12 weeks (BM: bone marrow, Oc: osteocyte, Ob: osteoblast, BV: blood vessel, FN: fibrous network). b) Quantitative analysis for the new bone formation percentage (%) calculated by the ratio between bone tissue area and implantation area in inset (a). All data are expressed as the mean ± standard deviation (SD), and * indicates statistically significant difference with p < 0.05 (n = 4).
