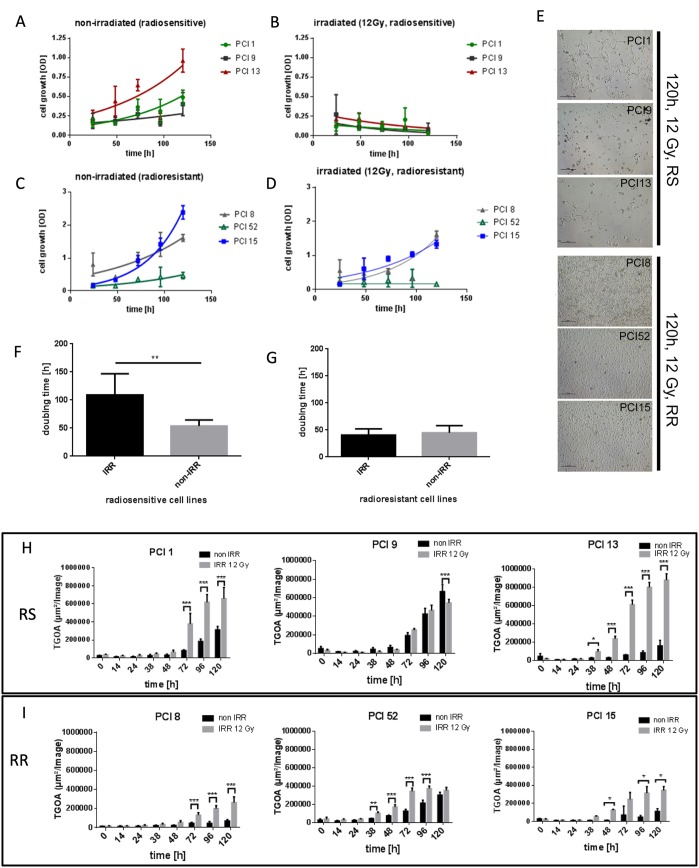
Figure 1. Characterization of radiosensitivity in six HNSCC cell lines via WST-1 viability assay.
(A, B) Viability of RS cell lines 24h – 120h after irradiation with 12Gy. Non-irradiated (non-IRR) cells served as control for unaffected proliferation. Non-IRR controls show constant proliferation during 120h of observation. (C, D) Viability of RR cell lines 24h–120h after irradiation. RR cells show proliferation and survival 120h after irradiation. (E) Representative images of RS cell lines PCI1, 9, 13 and RR cell lines PCI8, 52, 15, 120h after irradiation. 5 days after irradiation images were taken with 4-fold magnification. RS cell lines were strongly diminished 120h after irradiation, whereas RR cell lines reached confluence of 70% to 100%. (F, G) Doubling time of RS and RR cell lines. IRR RS cell lines reacted with extensively prolonged doubling time whereas doubling time of RR cells was unaffected by irradiation. (H) Characterization of radiosensitivity via live cell imaging. Each diagram represents the apoptosis rate of a single cell line as total green object area [μm2/Image] at depicted time points after irradiation with 12Gy. RS cell lines PCI1, 9, 13 show stronger overall induction of apoptosis compared to RR cell lines PCI8, 15, 52 (I). Black bars represent non-IRR controls (non-IRR). Gray bars represent IRR cells (IRR 12Gy). n=4, Two-Way ANOVA * = p < 0,05, ** = p < 0,01, *** p= < 0,001.

