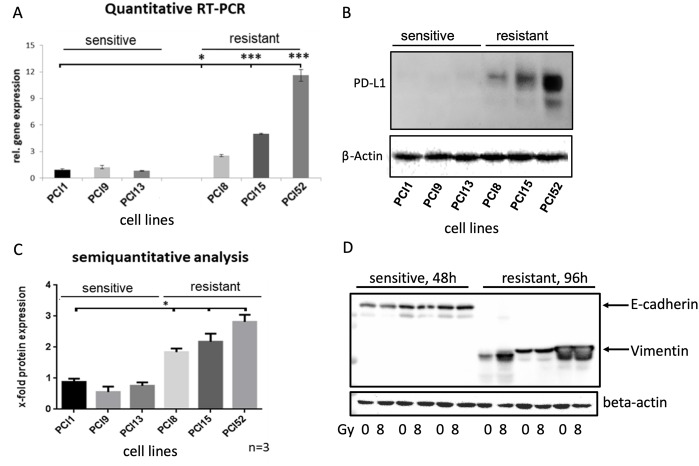
Figure 2. Differential PD-L1 protein expression in HNSCC cell lines with different radiosensitivity.
(A) Quantitative Taqman RT-qPCR showing basal gene expression of PD-L1. No significant difference in PD-L1 gene expression in RS cell lines PCI1, 9, 13, whereas all RR cell lines PCI8, 15, 52 showed significantly higher gene expression of PD-L1 one compared to RS reference PCI1. (B) Representative western blot showing basal protein expression of PD-L1. All RR HNSCC cell lines PCI8, 15, 52 show a markedly higher protein expression of PD-L1 than RS cell lines PCI1, 9, 13. (C) Semiquantitative analysis of western blot shows a consistent low protein expression of PD-L1 in RS cell lines. No significant difference observable in RS cell lines PCI1, 9, 13, whereas each RR cell lines PCI8, 15, 52 prove a significantly higher protein expression of PD-L1 in comparison to RS reference PCI1. (D) Western blot analysis of E-cadherin and Vimentin expression in RS and RR HNSCC cell lines. RS cell lines express E-cadherin but no Vimentin. RR cell lines express Vimentin but no E-cadherin. Lysates from RS cell were taken 48h after irradiation. For quantification the samples derive from the same experiment and blots were processed in parallel. The results are expressed as means ± SD * = p < 0,05, ** = p< 0,01, *** p= < 0.001 when compared to reference control PCI1. n=3, two-tailed Student’s t-Test. (* = p < 0,05).

