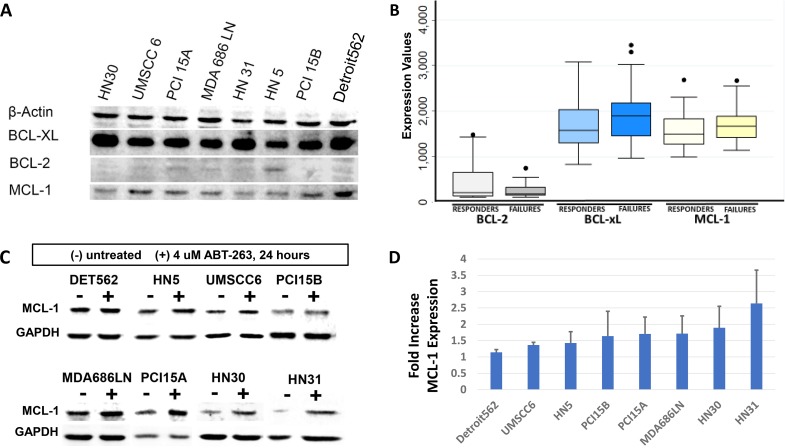
Figure 4. Evaluation of MCL-1 expression in HNSCC.
(A) Western blot demonstrating baseline MCL-1 expression in HNSCC cell lines, compared to BCL-xL and BCL-2 expression as demonstrated previously. Cell lines most resistant to radiation (HN5, PCI15B, Detroit562) demonstrate high MCL-1 expression. (B) Box and whisker plot representing gene expression transcript levels for BCL-2, BCL-xL, and MCL-1 as measured on gene expression microarrays in the HNSCC patient cohort, stratified by “responders” and “failures”. Lines represent median average transcript levels; Boxes represent 25th and 75th percentile, whiskers represent 2nd and 98th percentile. Dots represent outlying data points. (C) Western blot demonstrating MCL-1 protein expression at baseline, and 24 hours after treatment with 4μM ABT-263 (navitoclax). (D) Quantification of MCL-1 expression shows consistent increases of average MCL-1 expression, with standard deviation (error bars), after treatment with ABT-263 (navitoclax).

