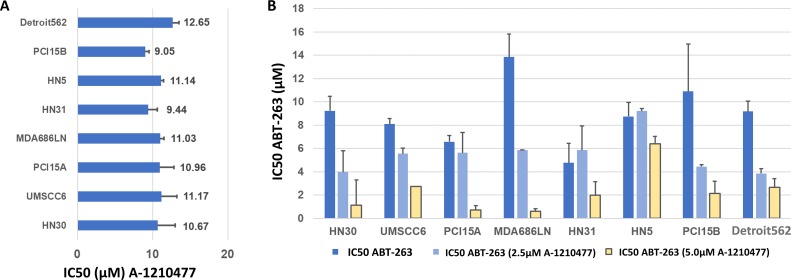
Figure 5. Inhibition of MCL-1 in HNSCC cells with A-1210477, alone and in combination with ABT-263 (navitoclax).
(A) Average IC50 values, with S.E.M. (error bars), for A-1210477 in HNSCC cell lines. (B) Average IC50 values, with S.E.M. (error bars), for ABT-263 (navitoclax) in combination with 2.5 μM and 5μM A-1210477. Note that baseline IC50 values for A-1210477 (A) vary slightly from control values (B) as these were carried out as independent experiments with triplicate data for each.

