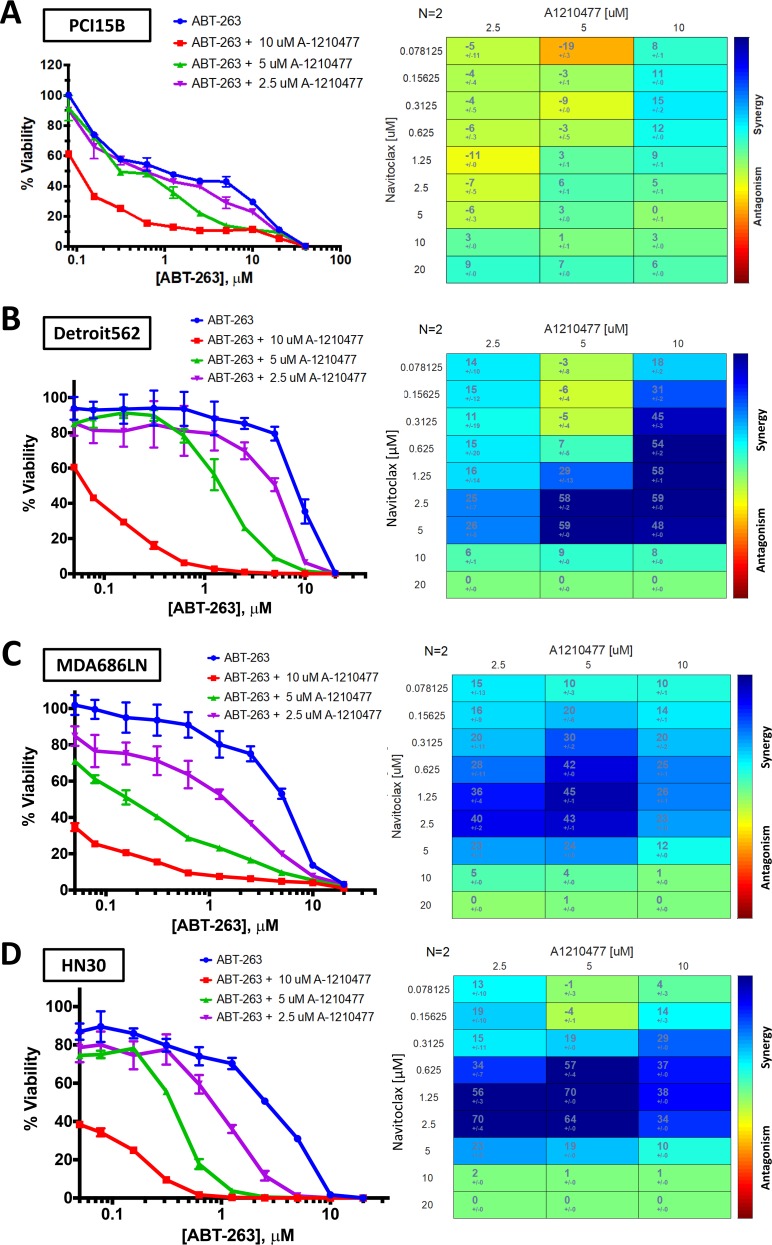
Figure 6. Bliss Independence analysis to evaluate synergistic activity between ABT-263 (navitoclax) and A-1210477.
Cell viability curves and Bliss Independence analysis scores after treatment with ABT-263 (navitoclax) and A-1210477 across varying doses in PCI15B (A), Detroit 562 (B), MDA686LN (C), and HN30 (D).

