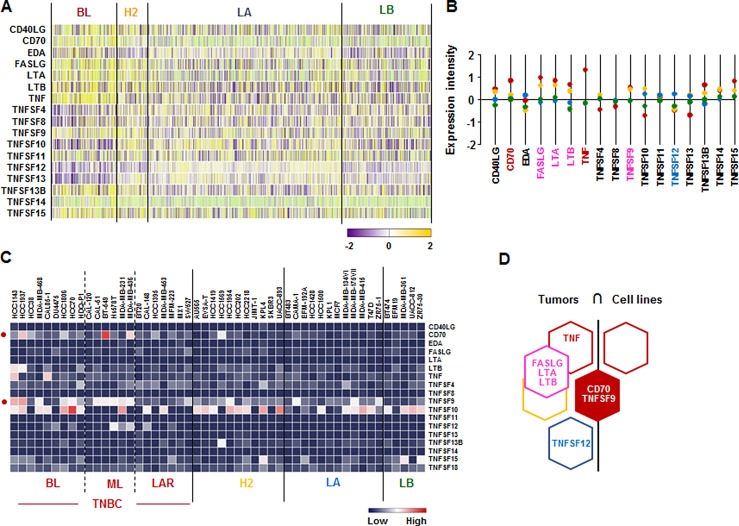
Figure 4. TNF superfamily signatures in BC tissues and cell lines.
(A) Heatmap for TNF superfamily expression profiles in human BC tissues from TCGA-based dataset using Gitools 2.3.1. (B) Statistical analysis of TNF superfamily expression intensity in human BC tissues. (C) Heatmap for RNA expression levels of TNF superfamily based on analysis of GEO dataset (Accession: GSE12777) with 51 human BC cell lines using Gitools 2.3.1. (D) Intersection of TNF superfamily signature between human BC tissues and cell lines. Red, yellow, blue and green dots specify high expression levels in BL-, HER2 (H2)-, LA- and LB-BC subtypes, respectively. Pink letters specify high expression levels in both BL- and HER2-BC subtypes. ML; mesenchymal-like, LAR; luminal androgen receptor and TNBC; triple-negative breast cancer.

