. 2019 Jan 15;8:e41463. doi: 10.7554/eLife.41463

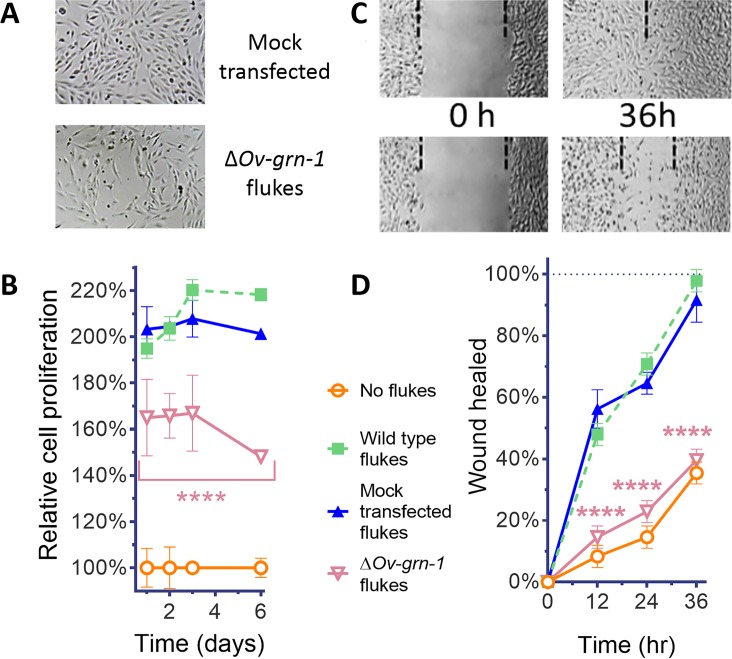
Figure 2. ES products of ΔOv-GRN-1 adult flukes induced less cell proliferation and wound repair in vitro.

(A) Representative cell proliferation images of H69 cholangiocyte cells co-cultured with flukes in Transwell plates; mock transfected (top) and ΔOv-GRN-1 (bottom) groups shown at day 3. (B) Reduced cell proliferation induced by ES products of ΔOv-GRN-1 fluke, as shown in panel (A), quantified from days 1 to 6. Data were plotted as mean relative percentage to control cells cultured in the absence of flukes. (C) Representative image of repair of wound from scratch in cultured H69 scratch during co-culture with flukes in Transwell plates. Mock transfected (upper) and ΔOv-GRN-1 (lower) groups shown at 0 and 36 hr after scratch wounding. Dotted line indicates the margin of the wound. (D) Scratch wound repair assay quantified from 0 to 36 hr, revealing diminished healing in cells co-cultured with the ΔOv-GRN-1 parasites. Panels (B) and (D): mean ±SD, three replicates; ****p < 0.0001 compared to wild-type flukes with two-way ANOVA Holm-Sidak multiple comparison test.

Figure 2.

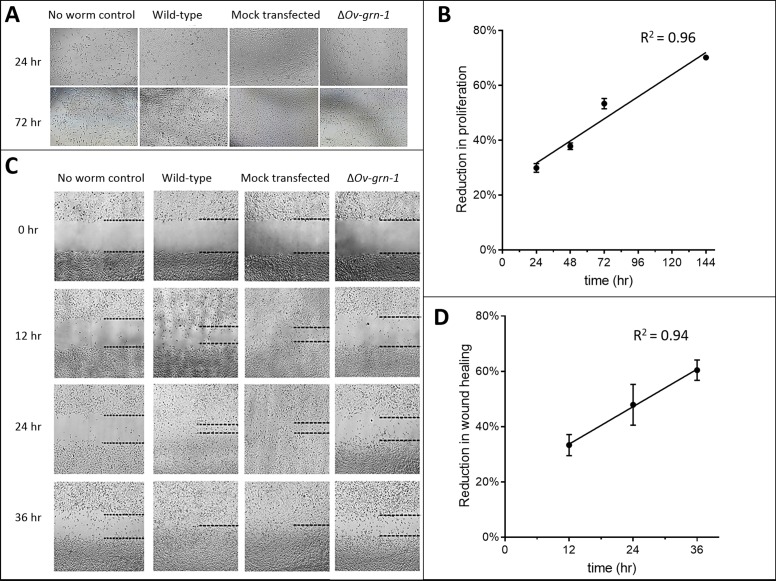
Figure 2—figure supplement 1. Extended set of images showing ΔOv-GRN-1 adult fluke ES products induce less in vitro cell proliferation and wound repair.

Figure 2—figure supplement 1.

(A) Representative cell proliferation images of H69 immortalized human cholangiocyte cell line co-cultured with flukes in Trans-well plates; shown at 24 and 72 hr. (B) Comparing the difference in cell proliferation values from Figure 2B between ES products from the ΔOv-GRN-1 flukes and ES from WT flukes revealed a linear correlation of reduction of cell proliferation that increases over time. (C) Representative image of scratch wound repair of cultured cholangiocytes when H69 cells were co-cultured in Trans-well plates with flukes; time points from 0 to 36 hr post-scratch. Dotted line indicates the margin of the wound. (D) Scratch wound repair assay quantified values from Figure 2D showed an increasing linear correlation over time of reduced wound closure when plotting the difference between the ΔOv-GRN-1 and the WT fluke groups. Panels (B) and (D): mean ±SD, three biological replicates.