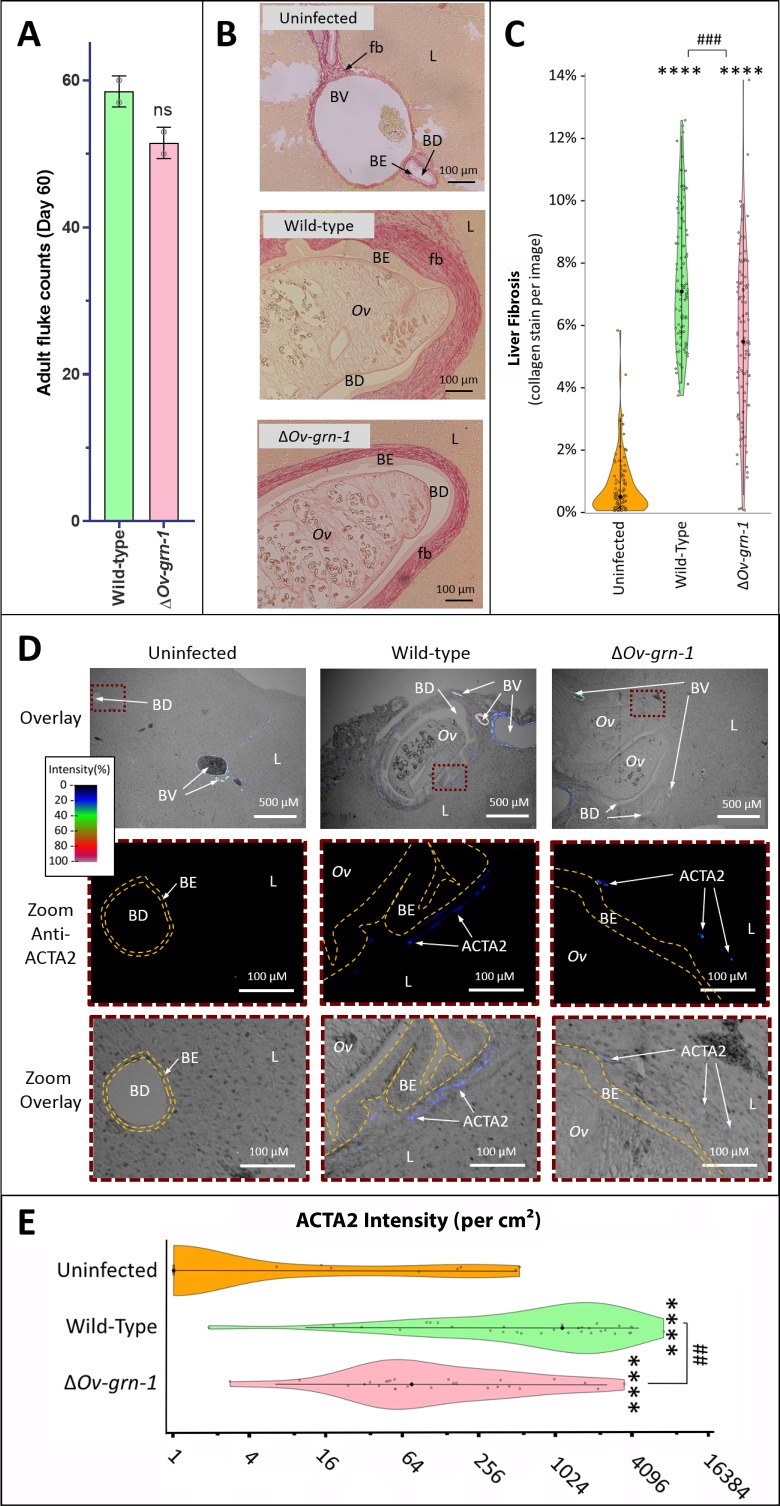
Figure 4. Reduced fibrosis during chronic infection of hamsters with gene-edited ΔOv-GRN-1 liver flukes.
(A) Adult fluke numbers were counted from the livers of necropsy at 60 days post-infection and presented as the average and range for two hamsters per group. Numbers of flukes were similar in the wild type (WT) and ΔOv-GRN-1 groups; non-significant (ns). (B) Representative micrographs of thin sections of Sirius red-stained liver (L) from uninfected hamsters revealed minimal deposition of collagen (fibrosis [fb]) in the periductal regions and adjacent liver parenchyma; a thin margin of red-stained material outlined the endothelial cells of the blood vessel (BV) walls, and the biliary epithelia (BE) of the bile ducts (BD). Livers from hamsters infected with WT flukes (Ov) included marked deposition of collagen with elongated BE cells adjacent to the flukes. There was substantial collagen deposition in livers of hamsters infected with ΔOv-GRN1 flukes compared to uninfected liver sections but far less than for hamsters infected with WT flukes. (C) Liver fibrosis quantified with ImageJ MRI-fibrosis plugin presented as violin plots: 100 images containing bile ducts from 20 sections (five hamsters) per group; mean (black dot)±SD (vertical line). Fibrosis was reduced in the ΔOv-GRN-1 (23% less) compared to WT fluke-infected hamsters. The width of the violin plot represents measurement frequency. The Kruskal-Wallis with Dunn’s multiple comparisons test was used to compare groups against the uninfected hamsters: ****p ≤ 0.0001; and ΔOv-GRN-1 against WT, ###p ≤ 0.001. (D) Representative micrographs, immunofluorescence/bright-field overlays, of sections probed with anti-ACTA2 antibody with fluorescence intensity indicated on a blue/green/red scale. ACTA2 was universally detected in myofibroblasts surrounding BV but not detected adjacent to healthy uninfected BD. The proximity of ACTA2 to fluke-infected BD was suggestive of myofibroblast generation in response to fluke-induced damage to BE. The upper row of micrographs (overlay) present combined bright-field and anti-ACTA2 fluorescence wide views of the liver sections. The boxed regions in the upper row indicate informative sites, which have been magnified and expanded in the central and lower rows of micrographs. The central row presents the boxed region with anti-ACTA2 fluorescence alone (Zoom Anti-ACTA2) and lower row presents the bright-field image overlaid by the fluorescence field (Zoom Overlay). Liver sections exhibited intense fluorescence surrounding BV (arterial blood vessels: red/green, venous vessels: blue/green), whereas in livers of uninfected hamsters BD exhibited only minimal fluorescence. The highlighted magnified (Zoom) rows of images revealed WT infected livers expressing mild (blue) but steady levels of ACTA2-staining surrounding thickened BE layer. The inner and outer BE cell margins are indicated by the dotted line (orange) around BDs with WT flukes. Livers from hamsters infected with ΔOv-GRN1 flukes showed irregular, generally feeble expression of ACTA2 proximal to BD. (E) Quantified levels of ACTA2 signals surrounding BDs from sections of hamster livers. Violin plot with reverse log2 Y-axis showing the ACTA2 intensity (per cm2 at 300 PPI) adjacent to BE, established from 25 to 30 discrete BD images per group (three hamsters), as assessed with ImageJ. Zero values from the uninfected group were deemed to have a value of 1 in order to plot the log axis. SD indicated as a line with the mean indicated by the central black dot, and the width of the violin indicative of frequency of measurement. ACTA2 staining showed 94% median reduction in ΔOv-GRN-1 fluke-infected livers compared to hamsters infected with WT liver flukes. One-way ANOVA with Holm-Sidak multiple comparison test, ****p ≤ 0.0001 compared to uninfected and ##p < 0.01 compared to ΔOv-GRN1 flukes against WT flukes.
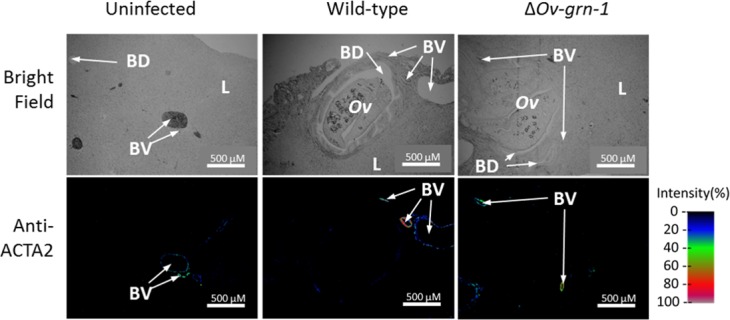
Figure 4—figure supplement 1. Representative wide-angle view of anti-ACTA2 immunofluorescence and bright field liver sections.


