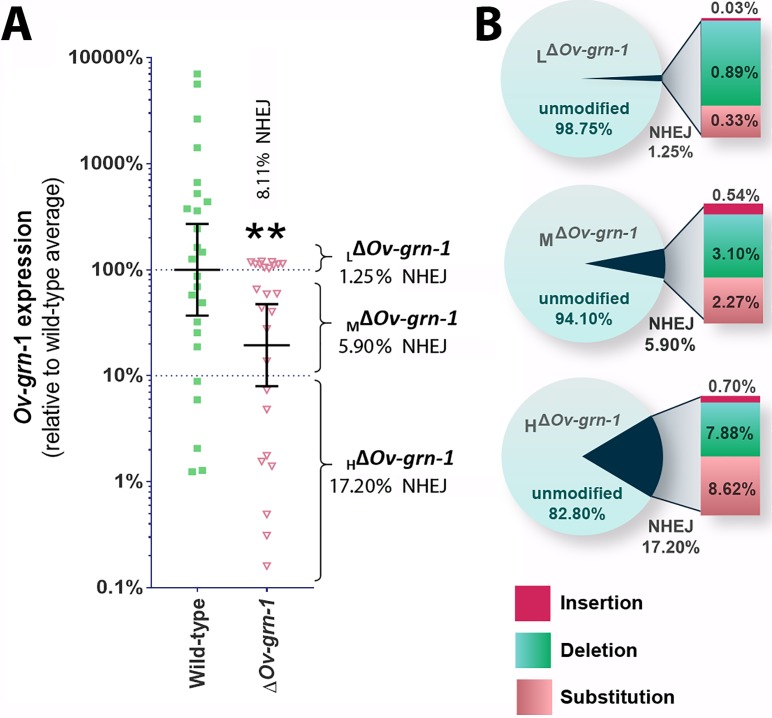
Figure 5. Characterization of gene knockout mutations in adult liver flukes from hamsters chronically infected hamsters.
Expression of Ov-GRN-1 transcripts was reduced in ΔOv-GRN-1 compared to WT flukes. (A) Reverse log10 Y-axis shows the qPCR 2(-ΔΔCt) findings from flukes 60 days after programmed CRISPR/Cas9-gene editing and hamster infection plotted relative to mean value for the WT infection. The WT group displayed a broad level of expression, whereas the mean expression level for the ΔOv-GRN-1 flukes was only 19.4% of the WT group; Mann-Whitney nonparametric test, **p ≤ 0.01. Although significantly lower as a group, individual worms of this ΔOv-GRN-1 cohort displayed phenotypes that ranged from no apparent effect (wild-type phenotype) to markedly diminished expression of Ov-GRN-1 (ΔOv-GRN-1 phenotype). Mutation frequency was assessed by assigning worms in the ΔOv-GRN-1 group into three sub-groups of flukes based on CRISPR/Cas9 mutation frequency. Eight flukes with effective CRISPR gene knockout (HΔOv-GRN1: Ov-GRN-1≤10% expression), seven flukes with modest levels of transcript knockout (MΔOv-GRN-1:>10 to<100% Ov-GRN-1), and 10 flukes exhibiting little or no effect (LΔOv-GRN-1: Ov-GRN-1 100–120%). The aggregate mutation frequency among the three ΔOv-GRN-1 sub-groups was 8.1% and 2.7% as estimated by the NGS-CRISPResso and tri-primer qPCR approaches, respectively. (B) Pie charts showing the CRISPResso estimated rate of programmed mutations in the LΔOv-GRN-1, MΔOv-GRN-1 and HΔOv-GRN1 sub-groups compared to non-mutated, WT reads. NHEJ mutation rate indicated by the pie slice (navy blue) and the proportion of each mutation sub-type is provided on the expanded bar at the right.

