. 2019 Jan 16;8:e43229. doi: 10.7554/eLife.43229

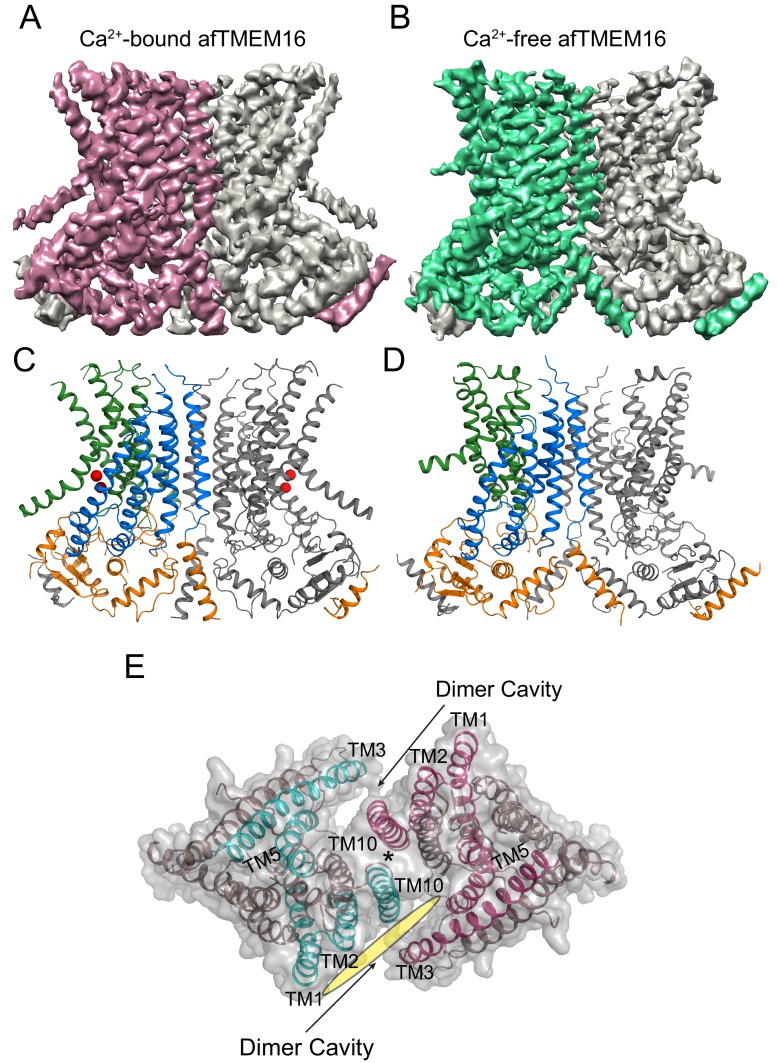
Figure 1. Structures of afTMEM16 in the presence and absence of Ca2+.

(A–B) Masked cryo EM density maps of afTMEM16 in the presence of 0.5 mM Ca2+ (A) or in Ca2+-free (B) conditions. For clarity, one monomer is shown in gray while the other is colored in red (A, 0.5 mM Ca2+) or green (B, 0 Ca2+). (C–D) atomic models of afTMEM16 reconstituted in nanodiscs in the presence of 0.5 mM Ca2+ (C) and in the absence of Ca2+ (D). For clarity one monomer is gray, in the other the cytosolic domain is orange, the permeation pathway is green and the remainder of the protein is blue. Ca2+ ions are shown as red spheres. (D) Top view of Ca2+-bound afTMEM16 shown as maroon ribbon inside its surface representation. The dimer cavities are labeled and one of the two is highlighted with a yellow oval. * denotes the protein’s twofold axis of symmetry between the two TM10’s. To illustrate the antiparallel orientation of the two dimer cavities, the cavity-lining helices (TM1, 2, 3, 5 and 10) from the two monomers are colored in cyan and red.

Figure 1.

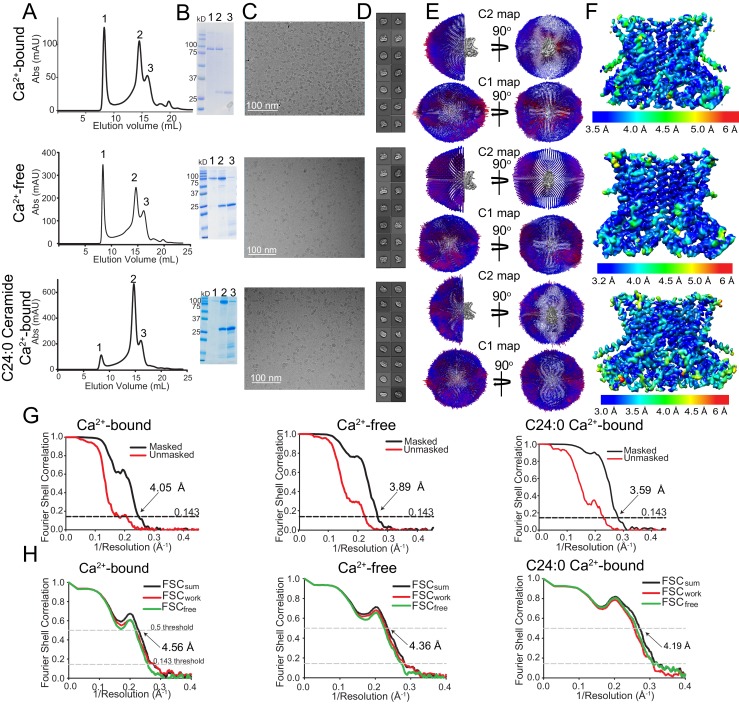
Figure 1—figure supplement 1. Cryo-EM characterization of afTMEM16/nanodisc complexes.

Figure 1—figure supplement 1.

(A–F) Top:+0.5 mM Ca2+. Middle: 0 Ca2+. Bottom:+0.5 mM Ca2+ and + 5 mole% C24:0. (A) Size exclusion profile of afTMEM16 in MSP1E3 nanodiscs. (B) SDS gel of the indicated size exclusion peaks using precision plus kaleidoscope ladder. Molecular weight (MW) of afTMEM16 is 84.5 kD and MW of MSP1E3 is 32.5 kD. (C) Representative cryo-EM micrographs of vitrified afTMEM16/nanodisc complexes. (D) Representative 2D-class averages, box size 275 Å. (E) Angular distribution representation of final, signal-subtracted C2 or C1 maps, number of views at each angular orientation is represented by length and color of cylinders where red indicates more views. (F) Final masked reconstruction colored by local resolution calculated using the Bsoft program BlocRes (Heymann, 2001; Cardone et al., 2013). (G) FSC plot indicating the resolution at the 0.143 threshold of final masked (black) and unmasked (red) map of afTMEM16 in the presence of 0.5 mM Ca2+ (left) absence of Ca2+ (middle), and presence of 0.5 mM Ca2+ and five mole% C24:0 (right). (H) FSC curves of refined models versus maps of afTMEM16 reconstituted in nanodiscs in the presence of 0.5 mM Ca2+ (left), in the absence of Ca2+ (middle) or with 0.5 mM Ca2+ and five mole% C24:0 ceramide (right). Black traces: FSC curves for the refined model compared to the final masked reconstruction (FSCsum). Red traces: FSC curves for the modified, refined model compared to the masked half-map 1 (FSCwork, used during validation refinement). Green traces: FSC curves for the modified, refined model compared to the masked half- map 2 (FSCfree, not used during validation refinement). Dashed lines show FSC threshold used for FSCsum of 0.5 and for FSCfree/work of 0.143. Statistics for the EM analysis and model building are reported in Supplementary file 3.
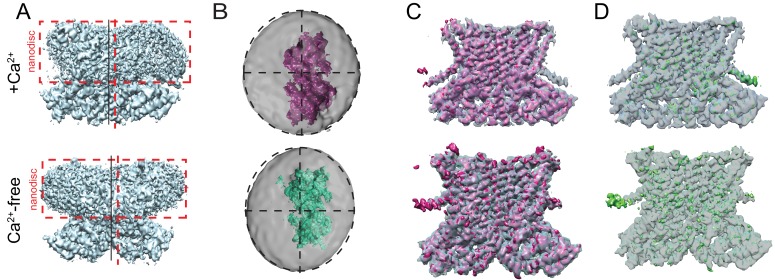
Figure 1—figure supplement 2. Asymmetry of afTMEM16-nanodisc complex.

Figure 1—figure supplement 2.

(A) Unmasked final C1 map highlighting the non-centered positioning of the protein within the nanodisc in the presence (top) and absence (bottom) of Ca2+. Dashed red box is drawn around the nanodisc and dashed vertical red line shows the symmetry axis of the nanodisc. Vertical black line shows the symmetry axis of the protein. (B) Top views of the afTMEM16-nanodisc complexes for afTMEM16 +Ca2+ (top, pink) and afTMEM16 Ca2+-free (bottom, green). The masked final maps are shown inside unmasked maps, which were low pass filtered to 10 Å and are shown at σ = 0.25. Dashed circles indicate the oval outline of nanodisc and the dashed lines denote the axis of the oval to highlight the different position of the protein map relative to the nanodiscs. (C) Overlay of C1 (solid pink) and C2 (transparent gray) maps for the + Ca2+ (top) and 0 Ca2+ complexes (bottom). (D) The difference map between the C1 and C2 maps (green) is shown inside the C2 map (gray transparent).
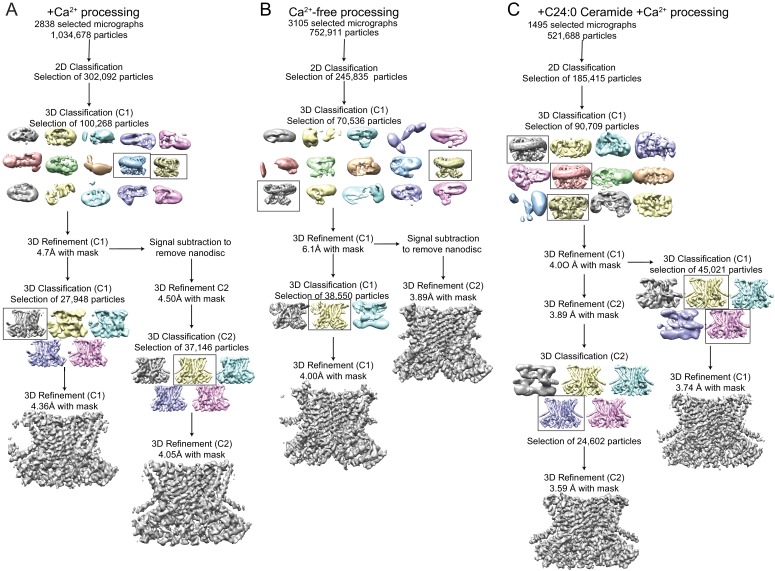
Figure 1—figure supplement 3. Cryo-EM data processing procedure for afTMEM16/nanodisc complexes.

Figure 1—figure supplement 3.

(A–C) Data processing flow chart for +Ca2+ (A), Ca2+-free (B), and +C24:0 Ceramide +Ca2+ (C). Particles picked from manually inspected micrographs were sorted with 2D and 3D classification in C1 before particle polishing and final masked refinement. For the +Ca2+ and Ca2+-free structures, particles were further classified and refined in C2 following signal subtraction of the nanodisc density. See Materials and methods for detailed procedure.
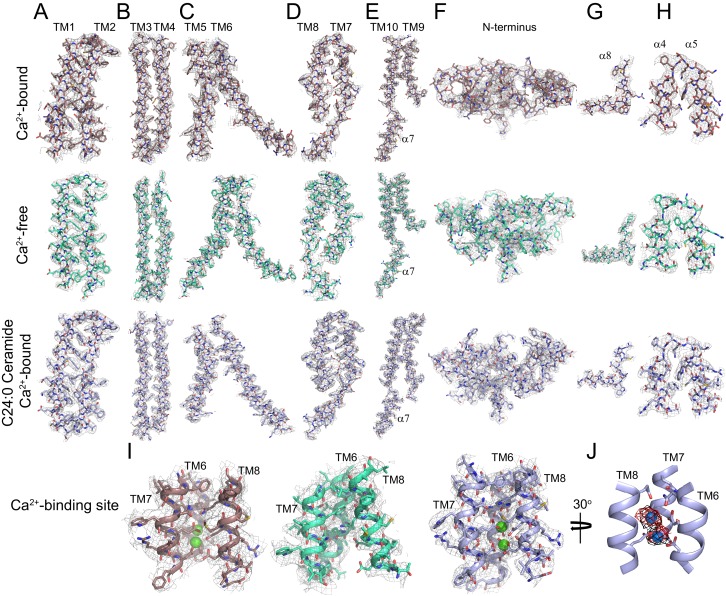
Figure 1—figure supplement 4. Representative cryo-EM density for afTMEM16 in 0.5 mM Ca2+, in 0 mM Ca2+ and in the presence of 0.5 mM Ca2+ and 5 mol% C24:0 Ceramide.

Figure 1—figure supplement 4.

(A–I) The cryo-EM density (gray mesh) is overlaid with the respective atomic models (sticks), Ca2+-bound afTMEM16 is in maroon (top panels), Ca2+-free is in cyan (middle panels) and Ca2+-bound afTMEM16 in the presence of C24:0 Ceramide is in light blue (bottom panels). Heteroatoms are colored as follows: oxygen is red, nitrogen is blue, and sulfur is yellow. (A–E) Transmembrane domains TM1-10 and cytosolic α7. (F) N-terminus containing α1–3, α6 and β1–3. (G) Close up of the domain-swapped region α8. (H) Close up of the cytosolic helices α4–5. (I) Ca2+ binding site consisting of portions of TM6-8 with Ca2+ ions shown in green. (J) Placement of Ca2+ ions (green) in the +Ca2+ + C24:0 Ceramide structure inside EM density map (black) and omit difference map (red).
Figure 1—figure supplement 5. Helical organization of afTMEM16.
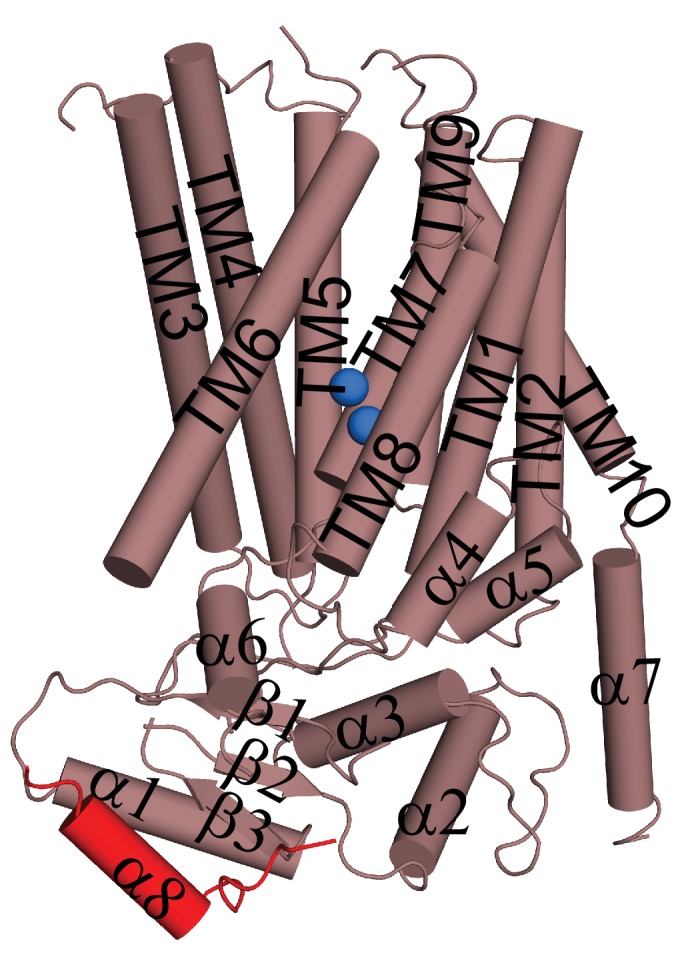
Figure 1—figure supplement 5.

Helices are shown as cylinders and the domain-swapped α8 from the other monomer is shown in red. Ca2+ ions are shown as blue spheres.
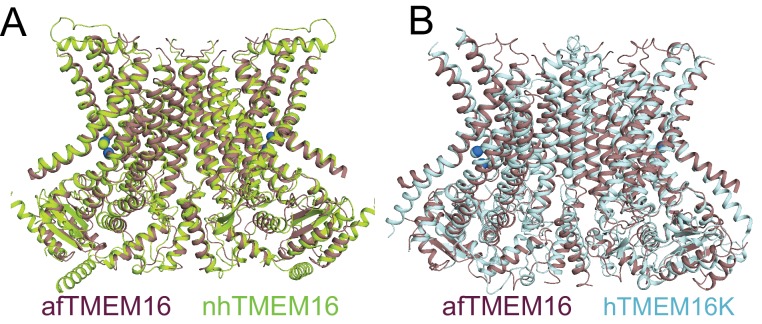
Figure 1—figure supplement 6. afTMEM16 in nanodiscs is very similar to nhTMEM16 and human TMEM16K in detergent.

Figure 1—figure supplement 6.

(A–B) Structural alignment of the atomic models of Ca2+-bound afTMEM16 in nanodiscs (purple) and nhTMEM16 in detergent (limon, PDBID 4WIS, Cα RMSD 1.92 Å) of hTMEM16K in detergent (light blue, PDBID 5OC9, Cα RMSD 3.69 Å).