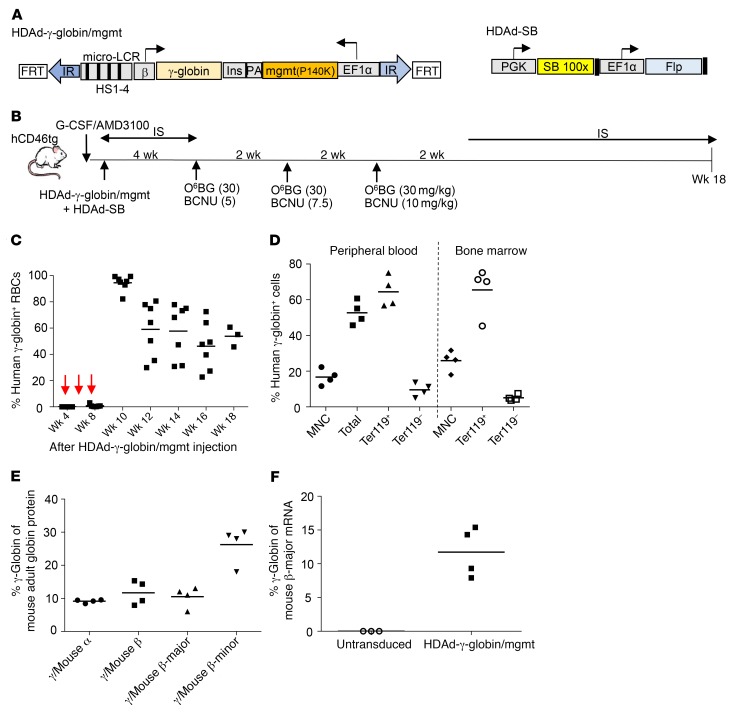
Figure 1. Integrating HDAd5/35++ vector for HSPC gene therapy of hemoglobinopathies.
(A) Vector structure. In HDAd-γ-globin/mgmt, the 11.8-kb transposon is flanked by inverted transposon repeats (IR) and FRT sites for integration through a hyperactive Sleeping Beauty transposase (SB100X) provided from the HDAd-SB vector (right panel). The γ-globin expression cassette contains a 4.3-kb version of the β-globin LCR consisting of 4 DNase hypersensitivity (HS) regions and the 0.7-kb β-globin promoter. The 76-Ile HBG1 gene including the 3′-UTR (for mRNA stabilization in erythrocytes) was used. To avoid interference between the LCR/β-promoter and EF1A promoter, a 1.2-kb chicken HS4 chromatin insulator (Ins) was inserted between the cassettes. The HDAd-SB vector contains the gene for the activity-enhanced SB100X transposase and Flpe recombinase under the control of the ubiquitously active PGK and EF1A promoters, respectively. (B) In vivo transduction of mobilized CD46tg mice. HSPCs were mobilized by s.c. injections of human recombinant G-CSF for 4 days followed by 1 s.c. injection of AMD3100. Thirty and 60 minutes after AMD3100 injection, animals were injected i.v. with a 1:1 mixture of HDAd-γ-globin/mgmt plus HDAd-SB (2 injections, each 4 × 10¹⁰ viral particles). Mice were treated with immunosuppressive (IS) drugs for the next 4 weeks to avoid immune responses against the human γ-globin and MGMT(P140K). O6-BG/BCNU treatment was started at week 4 and repeated every 2 weeks 3 times. With each cycle the BCNU concentration was increased, from 5 to 7.5 to 10 mg/kg. Immunosuppression was resumed 2 weeks after the last O6-BG/BCNU injection. (C) Percentage of human γ-globin+ peripheral RBCs measured by flow cytometry. (D) Percentage of human γ-globin+ cells in peripheral blood mononuclear cells (MNC), total cells, erythroid Ter119+ cells, and nonerythroid Ter119– cells. (E) Percentage of human γ-globin protein compared with adult mouse globin chains (α, β-major, β-minor) measured by HPLC in RBCs at week 18. (F) Percentage of human γ-globin mRNA compared with adult mouse β-major globin mRNA measured by RT-qPCR in total in peripheral blood cells at week 18. Mice that did not receive any treatment were used as a control. In C–F, each symbol represents an individual animal.

