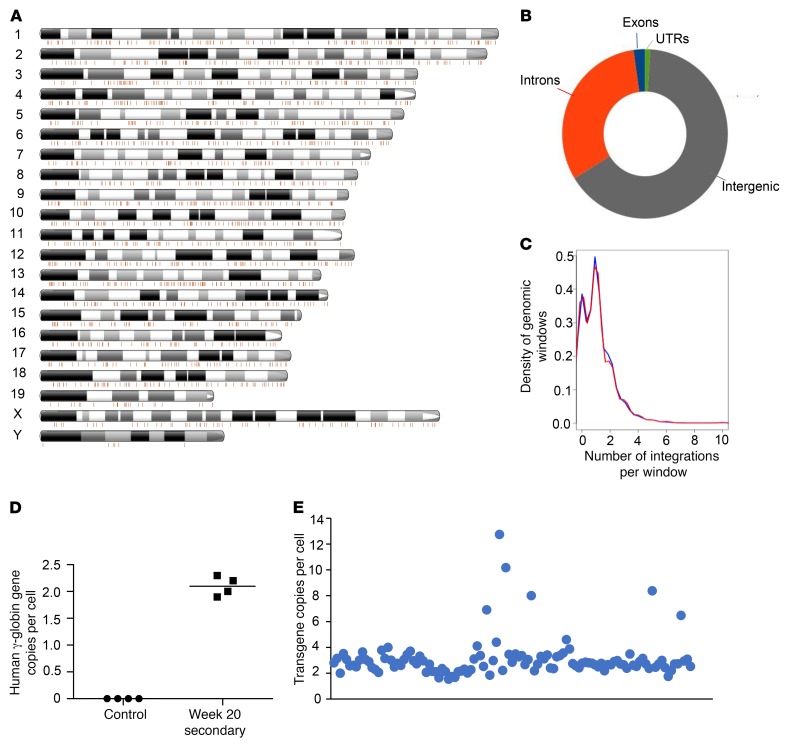
Figure 2. Analysis of transgene integration in bone marrow cells of week 20 secondary recipients.
(A) Localization of integration sites on mouse chromosomes of bone marrow cells. Shown is a representative mouse. Each line is an integration site. The number of integration sites in this sample is 2,197. (B) Distribution of integrations in genomic regions. Integration site data from 5 mice were pooled and used to generate the graph. (C) The number of integrations overlapping with continuous genomic windows and randomized mouse genomic windows and size was compared. Pooled data were used as in B. The Pearson’s χ2 test P value for similarity is 0.06381, implying that the integration pattern is close to random. (D) Transgene copy numbers. Genomic DNA from total bone marrow cells from untransduced control mice and week 20 secondary recipients was subjected to qPCR with human γ-globin–specific primers. Shown is the copy number per cell for individual animals. Each symbol represents an individual animal. (E) Transgene copy numbers in individual clonal progenitor colonies. Bone marrow Lin– cells were plated in methylcellulose, and individual colonies were picked 15 days later. qPCR was performed on genomic DNA. Shown is normalized qPCR signal in individual colonies expressed as transgene copy number per cell (n = 113). Each symbol represents the copy number in an individual colony derived from a single cell.

