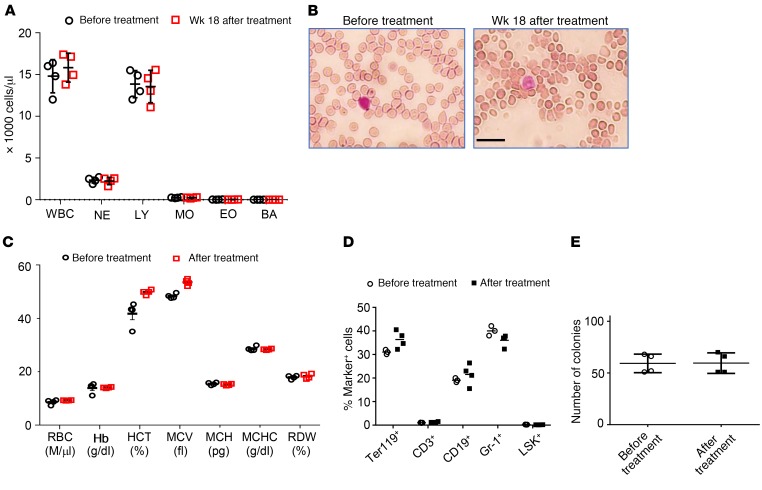
Figure 3. Hematological parameter after in vivo HSPC transduction/selection in CD46tg mice (week 18 after HDAd injection).
(A) WBC counts. (B) Representative blood smears from an untreated mouse and a mouse at week 18 after HDAd-γ-globin/mgmt plus HDAd-SB injection. Scale bar: 20 μm. Nuclei of WBCs stain purple. (C) Hematological parameters. Hb, hemoglobin; HCT, hematocrit; MCV, mean corpuscular volume; MCH, mean corpuscular hemoglobin; MCHC, mean corpuscular hemoglobin concentration; RDW, red cell distribution width. n ≥ 3, *P < 0.05. Statistical analysis was performed using 2-way ANOVA. (D) Cellular bone marrow composition in naive mice (control) and treated mice sacrificed at week 18. Shown is the percentage of lineage marker–positive cells (Ter119+, CD3+, CD19+, and Gr-1+ cells) and HSPCs (LSK cells). (E) Colony-forming potential of bone marrow Lin– cells harvested at week 18 after in vivo transduction. Shown is the number of colonies that formed after plating of 2,500 Lin– cells. In A and C–E, each symbol represents an individual animal. NE, neutrophils; LY, lymphocytes; MO, monocytes; BA, basophils.

