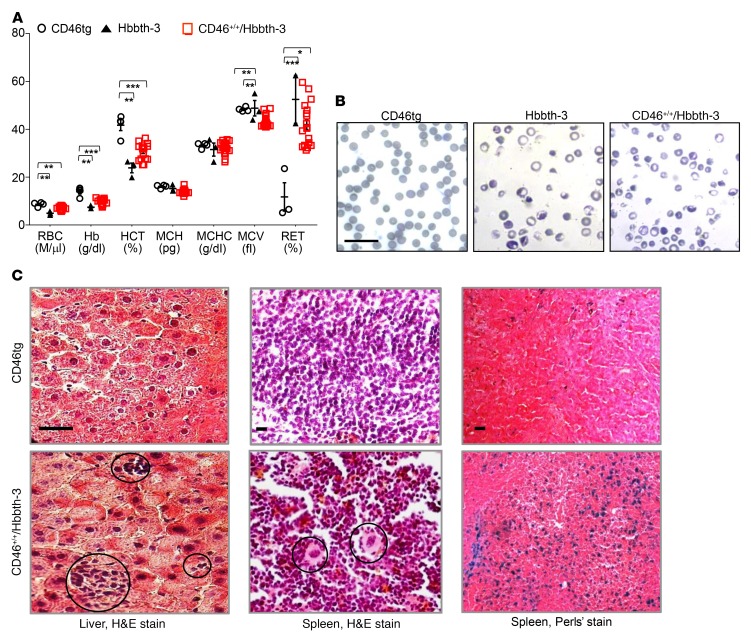
Figure 4. Phenotype of the CD46+/+/Hbbth-3 mouse thalassemia model.
(A) Hematological parameters of CD46+/+/Hbbth-3 mice (n = 7) as compared with CD46tg (n = 3) and Hbbth-3 mice (n = 3). Each symbol represents an individual animal. *P ≤ 0.05, **P ≤ 0.0002, ***P ≤ 0.00003. Statistical analysis was performed using 2-way ANOVA. RET, reticulocytes. (B) Representative peripheral blood smears after staining with May-Grünwald/Giemsa. Scale bar: 20 μm. (C) Extramedullary hemopoiesis by H&E staining in liver and spleen sections of CD46+/+/Hbbth-3 mice (bottom left 2 panels) as compared with spleen and liver sections of CD46tg mice (top left 2 panels). Scale bars: 20 μm. Clusters of erythroblasts in the liver are indicated in the bottom left panel. Circles in the bottom middle panel mark megakaryocytes in the spleen. Iron deposition (granular bluish deposits) by Perls’ staining in the spleen are shown in the top right panel for CD46tg and the bottom right panel for CD46+/+/Hbbth-3 mice. Scale bar: 25 μm.

