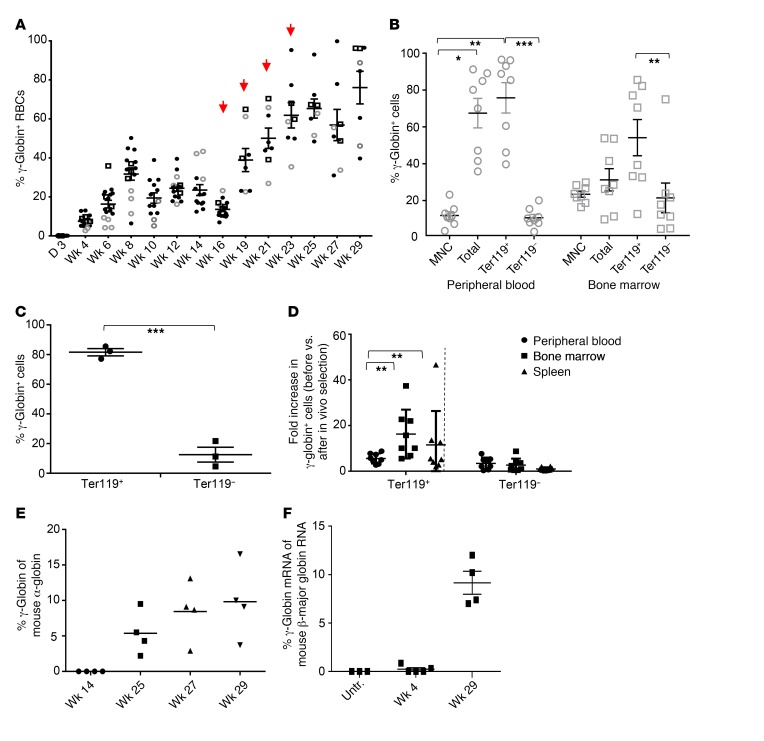
Figure 6. Analysis of γ-globin expression in in vivo–transduced CD46+/+/Hbbth-3 mice after in vivo selection.
(A) Percentage of human γ-globin in peripheral RBCs measured by flow cytometry. Red arrows indicate the time points of O6-BG/BCNU treatment. Different symbols represent 3 independent experiments. The data up to week 16 are identical to those in Figure 5A. (B) Percentage of γ-globin–expressing cells in hematopoietic tissues at sacrifice (week 29) analyzed by flow cytometry. *P ≤ 0.05, **P ≤ 0.0002, ***P ≤0.00003. (C) γ-Globin expression in MACS-purified Ter119 cells. Bone marrow cells from primary recipients at week 29 were immunomagnetically selected for Ter119+ cells. γ-Globin expression was measured in Ter119+ and Ter119– cells by flow cytometry. ***P ≤ 0.0002. (D) Fold enrichment of γ-globin+ erythroid (Ter119+) and nonerythroid (Ter119–) cells in peripheral blood, bone marrow, and spleen before versus after in vivo selection (week 16 vs. week 29). n = 5, **P ≤ 0.0002. (E) Percentage of human γ-globin protein compared with mouse α-globin protein, measured by HPLC in RBCs. Statistical analyses were done with the nonparametric Kruskal-Wallis test. (F) Level of human γ-globin mRNA over adult mouse β-major globin mRNA measured by RT-qPCR in peripheral blood cells. Untreated CD46+/+/Hbbth-3 mice were used as control. Each symbol represents an individual animal.

