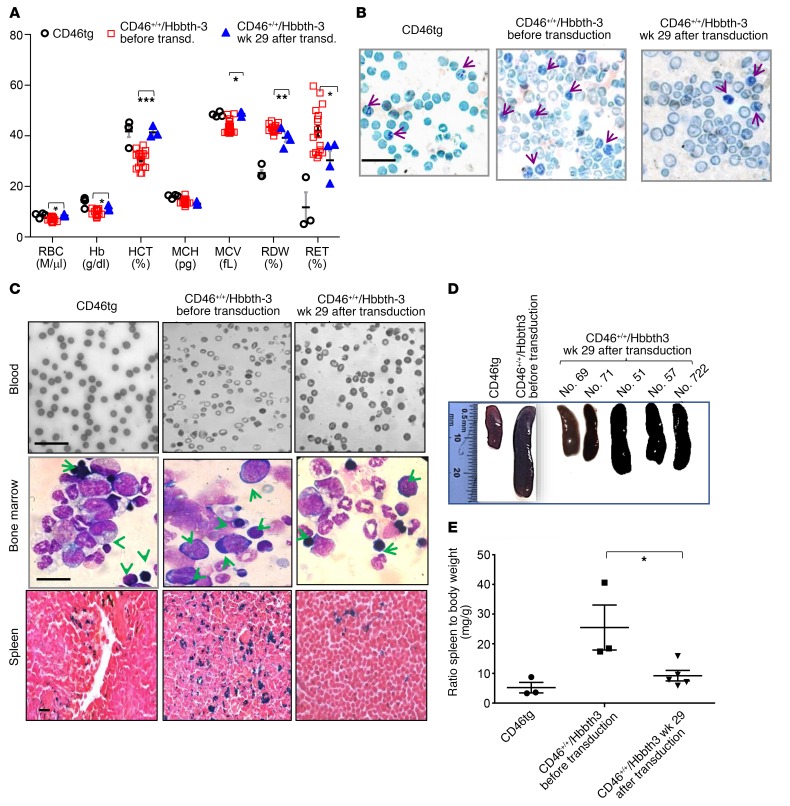
Figure 7. Phenotypic correction of CD46+/+/Hbbth-3 mice by in vivo HSPC transduction/selection.
(A) RBC analysis of healthy (CD46tg) mice, CD46+/+/Hbbth-3 mice prior to mobilization and in vivo transduction, and CD46+/+/Hbbth-3 mice that underwent in vivo transduction/selection (analyzed at week 29 after HDAd infusion) (n = 5). *P ≤ 0.05, **P ≤ 0.0002, ***P ≤ 0.00003. Statistical analysis was performed using 2-way ANOVA. (B) Supravital stain of peripheral blood smears with Brilliant cresyl blue for reticulocyte detection. Arrows indicate reticulocytes containing characteristic remnant RNA and micro-organelles. The percentages of positively stained reticulocytes in representative smears were: for CD46, 7%; for CD46+/+/Hbbth-3 before treatment, 31%; and for CD46+/+/Hbbth-3 after treatment, 12%. Scale bar: 20 μm. (C) Top: Blood smears. Scale bar: 20 μm. Middle: Bone marrow cytospins. Arrows indicate erythroblasts at different stages of maturation and a backshift in erythropoiesis with pro-erythroblast predominance in treated mice. Scale bar: 25 μm. Bottom: Tissue hemosiderosis by Perls’ stain. Iron deposition is shown as cytoplasmic blue pigments of hemosiderin in spleen tissue sections. The blood smear images for the control mice (CD46tg and CD46+/+/Hbbth-3, before transduction) in C and Figure 5D are from the same sample. (D) Macroscopic spleen images of 1 representative CD46tg and 1 untreated CD46+/+/Hbbth-3 mouse and 5 treated CD46+/+/Hbbth-3 mice. (E) At sacrifice, spleen size was determined as the ratio of spleen weight to total body weight (mg/g). Each symbol represents an individual animal. Data are presented as means ± SEM. *P ≤ 0.05. Statistical analysis was performed using 1-way ANOVA.

